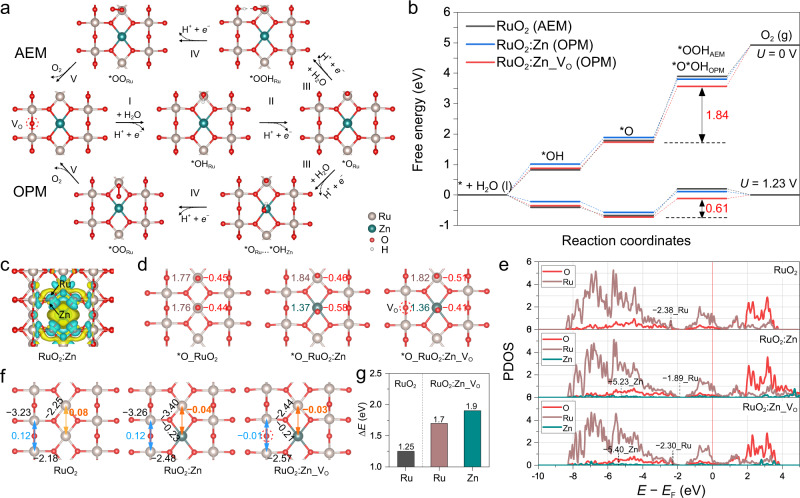
Fig. 5. OER mechanism analysis.
a AEM and OPM paths of OER on the RuO2:Zn_VO surface. b The free energy diagrams for preferred OER paths on the surfaces of RuO2, RuO2:Zn, and RuO2:Zn_VO. c Differential charge density analysis of RuO2:Zn. The blue and yellow shaded area mean the electron density accumulation and donation. d Bader charge analysis for Ru (brown), Zn (dark cyan), and O (red) sites on the double *O adsorbed surfaces of RuO2, RuO2:Zn, and RuO2:Zn_VO. e PDOS of Ru 4d, O 2p, and Zn 3d-bands for RuO2, RuO2:Zn, and RuO2:Zn_VO; corresponding d-band centers are denoted by dashed lines. f ICOHP analysis of Ru−O, Ru···Ru, Ru···Zn, and Zn−O on the surfaces of RuO2, RuO2:Zn, and RuO2:Zn_VO. g De-metallization energies of Ru from RuO2, and Ru and Zn from RuO2:Zn_VO.

