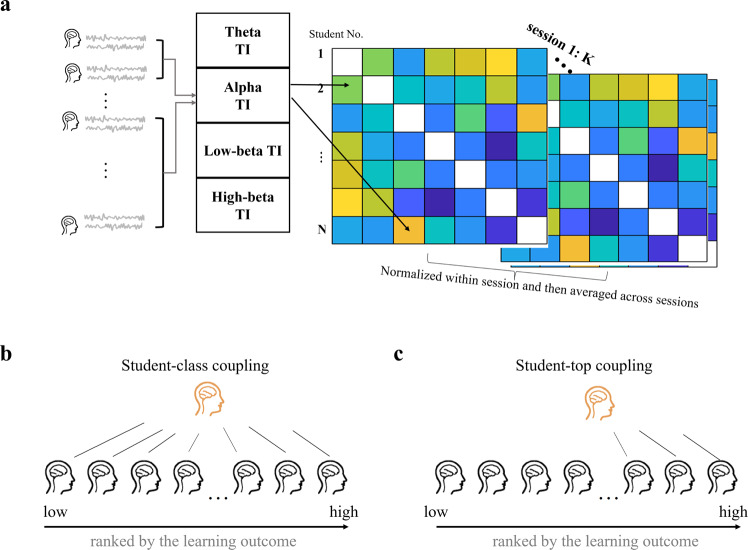
Fig. 2. A schematic illustration of the inter-brain coupling analysis.
a Computations of pairwise total interdependence (TI) matrix for each pair of students for each session, at the frequency bands of theta, alpha, low-beta, and high-beta. The TI values were then normalized within each session and averaged across sessions to obtain an inter-brain coupling value for each pair of students. b Student-class coupling was obtained by averaging TI values over all possible pairwise combinations between one student and the rest of the class. c Student-top coupling was computed by averaging TI values over all possible pairwise combinations between one student and all the top students in the class, except for this student himself/herself if the student was one of the top students. Here, N is the number of students, K is the total number of sessions.

