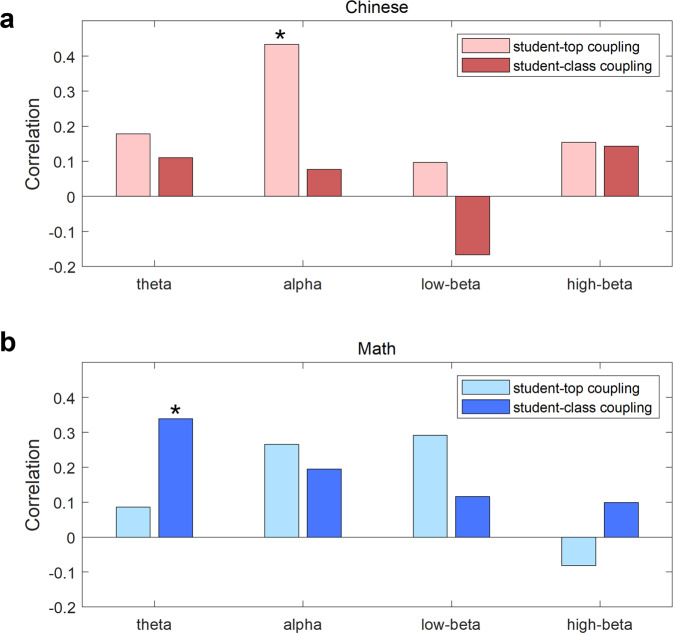
Fig. 5. The summary of correlations between inter-brain couplings and learning outcomes.
Correlation r values between inter-brain couplings and the final exam scores at the theta, alpha, low-beta, and high-beta bands for (a) Chinese and (b) Math. Bars with a lighter color indicated student-top-coupling-based correlations (top students’ number = 4), and bars with a darker color indicated student-class-coupling-based correlations. Stars indicated a significant correlation when both Pearson’s p and permutation p were smaller than 0.05.

