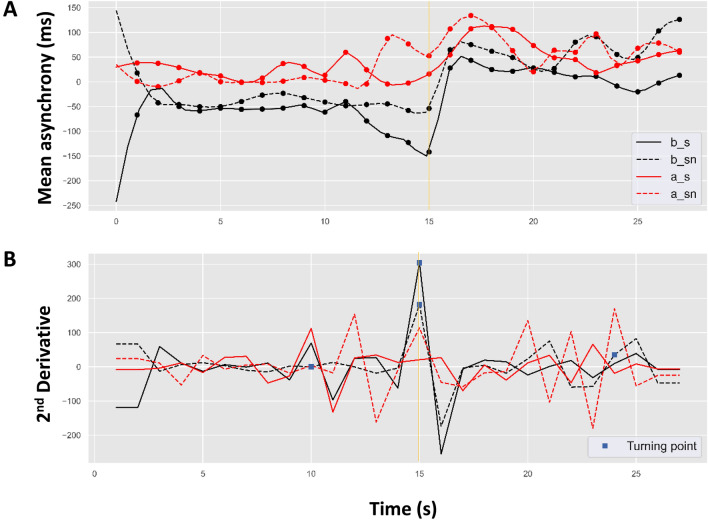
Figure 3.
(A) Estimated asynchrony trend during maintenance (pacing followed by continuation) and (B) second derivatives of the corresponding trends locating the turning points (blue square marks) in: blocked synchronization (b_s as solid black line); blocked syncopation (b_sn as dashed black line); alternating synchronization (a_s as solid red line); and alternating syncopation (a_sn as dashed red line). Gold vertical solid line represents continuation phase onset.

