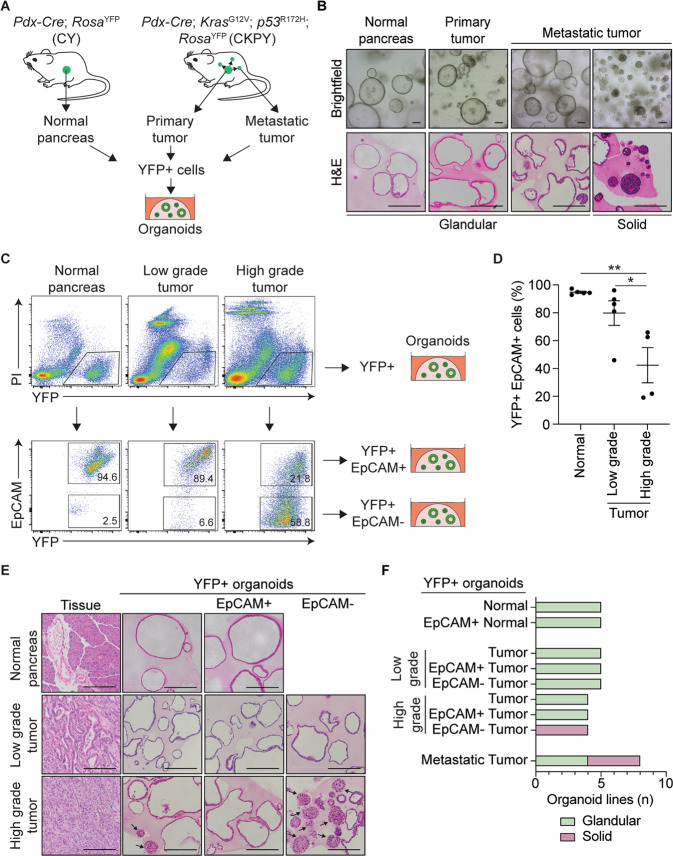
Fig. 1. Generation of a murine organoid biobank with different morphological features.
A Schematic representation of the workflow to generate organoids from primary and metastatic secondary tumors in the KPC model. YFP + cells FACS isolated from Pdx-Cre; RosaYFP (CY) mice were used to generate normal pancreatic organoids, while YFP + cells FACS isolated from either primary tumors or secondary tumors (liver, lung, and diaphragm) from Pdx-Cre; KrasG12V; p53R172H; RosaYFP (CKPY) mice were used to generate tumor organoids. B Representative brightfield (top) and H&E (bottom) images of normal pancreatic, primary tumor and metastatic tumor organoids. Representative glandular and solid subtype organoids are shown. Scale bar = 100 μm. C Representative FACS plots for isolation of YFP + EpCAM+ and YFP + EpCAM- cells from normal pancreas (N = 5), low-grade tumor (N = 5) and high-grade tumor (N = 4) for the generation of organoids. D Percentage of live YFP + EpCAM+ cells isolated from the normal pancreas from CY mice (N = 5), and either low-grade tumors (N = 5) or high-grade (N = 4) pancreatic tumors from CKPY mice. Each dot represents an individual mouse. Data are presented as mean + /− SEM. *p < 0.05, Student’s t-test. E Representative H&E images of the primary tumor and corresponding YFP + (left), YFP + EpCAM + (middle) and YFP + EpCAM- (right) organoids. Scale bar = 100 μm. F Quantification of the organoid morphology for each MO line, represented as glandular (green) or solid (red).

