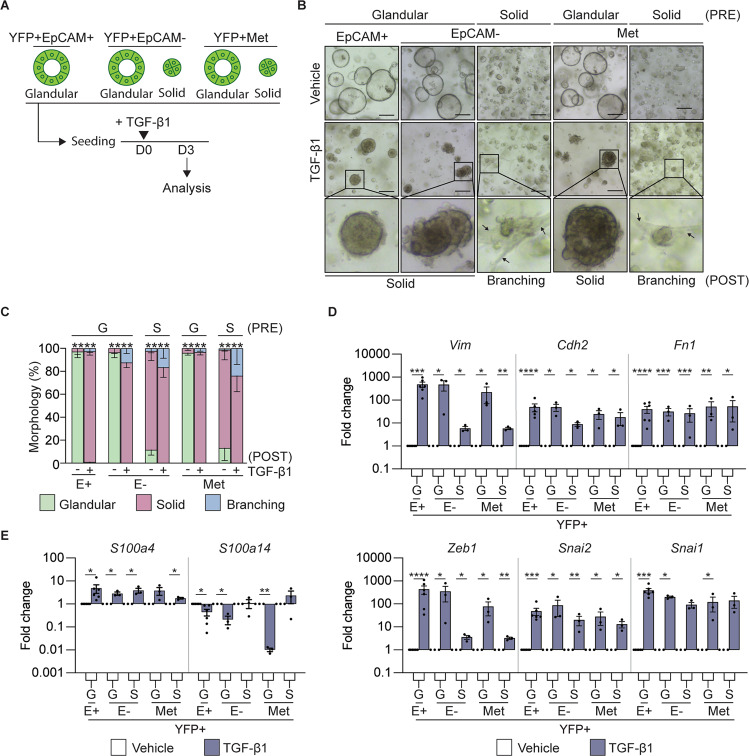
Fig. 3. TGF-β1 treatment induces a mesenchymal signature in tumor organoids.
A Schematic representation of the treatment of murine tumor organoids seeded as single cells with recombinant TGFβ1 and timing of quantification of the morphology and gene expression signatures. B Representative brightfield images of YFP + EpCAM + (N = 6), YFP + EpCAM- (N = 6) and YFP + secondary (Met, N = 6) tumor organoids on day 3 post TGFβ1 treatment. The pre-treatment (PRE) organoid morphology is indicated. Representative images of organoids post-treatment (POST) are shown. Arrows indicate a branching phenotype. Images are representative of 3 biological replicates. Scale bar = 300 μm. C Quantification of the tumor organoid morphology 3 days post TGFβ1 treatment. YFP + EpCAM + (N = 6), YFP + EpCAM- (N = 6) and YFP + secondary (Met; N = 6) tumor organoids. Organoids are grouped as glandular (G) and solid (S) morphologies pre-treatment (PRE). Quantification of glandular (green), solid (red) and branching (blue) post cytokine treatment (POST). Data includes 3 biological replicates and is presented + /− SEM. ****p < 0.0001, Chi-square test. D, E mRNA expression levels of mesenchymal markers, Vim, Cdh2, Fn1, Snai1, Snai2, Zeb1 (D); and S100 family members, S100a4, S100a14 (E), in YFP + EpCAM + (E+), YFP + EpCAM- (E-) primary tumor organoids and YFP + secondary tumor organoids following the addition of TGFβ1 (blue). Each dot represents an individual organoid line. Organoids are grouped as glandular (G) and solid (S) morphologies. Data includes three biological replicates and is presented as log10 fold change relative to the vehicle (white) control, mean + /− SEM. *p < 0.05, **p < 0.01, ***p < 0.001, ****p < 0.0001, paired t-test.

