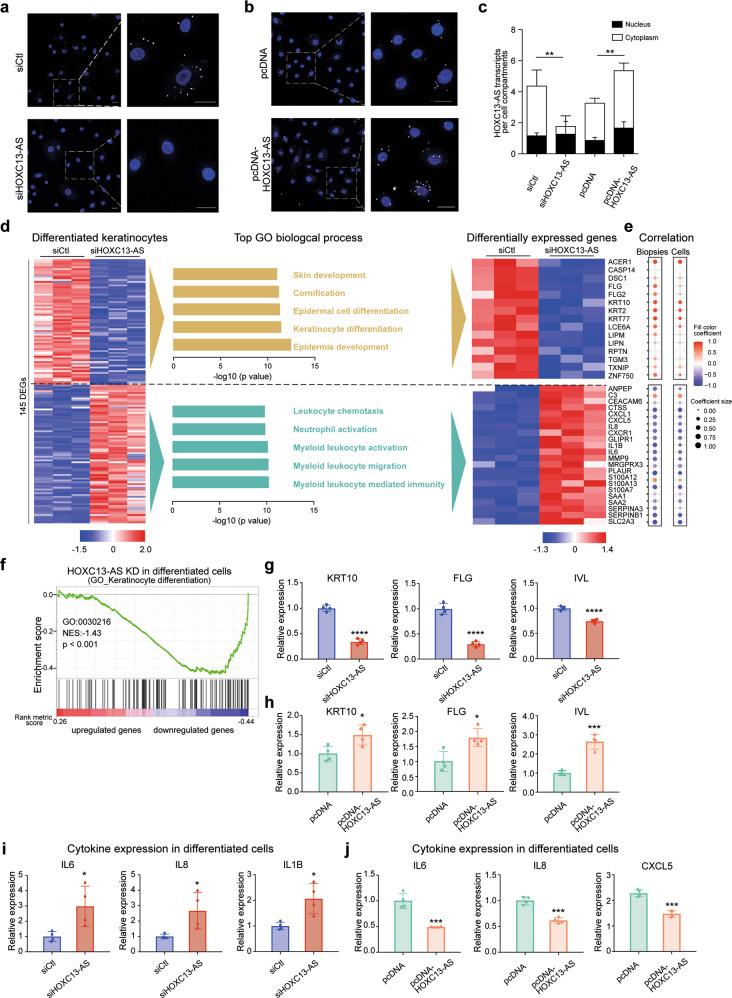
Fig. 4. HOXC13-AS regulates keratinocyte differentiation and inflammatory response.
Representative photographs (a, b) and quantification (c) of HOXC13-AS FISH in keratinocytes transfected with HOXC13-AS siRNA pool or nontargeting control (siCtl) (a), pcDNA-HOXC13-AS or empty vector (b) (n = 3). Cell nuclei were co-stained with DAPI. Scale bar = 20 μm. d Microarray analysis of differentiated keratinocytes transfected with HOXC13-AS siRNA pool or siCtl. Heatmap (left panel) illustrates the differentially expressed genes (DEGs, |Fold change| ≥ 2, FDR < 0.05). GO analysis of the DEGs is shown in the middle panel. The DEGs associated with the GO terms are shown in the heatmap (right panel). e Their expression correlation with HOXC13-AS in the skin and wound biopsies and isolated epidermal cells analyzed by RNA-seq. f GSEA evaluated enrichment for the keratinocyte differentiation-related genes (GO:0030216) in the microarray data. NES normalized enrichment score. QRT-PCR analysis of KRT10, FLG and IVL expression in differentiated keratinocytes transfected with HOXC13-AS siRNA pool (g) or pcDNA-HOXC13-AS (h) compared to respective controls (n = 4). QRT-PCR analysis of cytokine expression in differentiated keratinocytes transfected with HOXC13-AS siRNA pool (i) or pcDNA-HOXC13-AS (j) compared to respective controls (n = 4). *p < 0.05, **p < 0.01, ***p < 0.001, and ****p < 0.0001 by unpaired two-tailed Student’s t test (c, g–j), or Pearson’s correlation test (e). Data are presented as mean ± SD.

