
FIGURE 3.
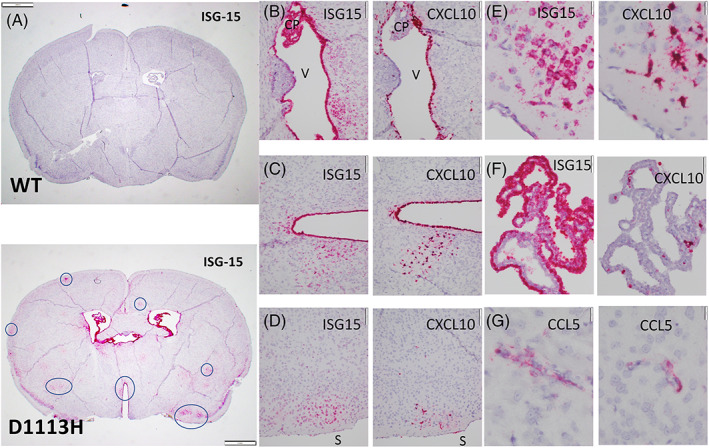
ISH on sections of FFPE paraffin embedded brains. (A) Low power complete coronal section from 8‐week‐old WT (top) and D1113H (bottom) mice were hybridized for ISG‐15. At 8 weeks WT mice showed essentially no hybridization. The brains of D1113H mice showed lateral and third ventricular dilation and multiple variably distributed foci of strong and diffuse staining for ISG15 in neurons (7 foci circled). Staining was greater in superficial neurons than deep neurons. There was intense staining of ependymal and choroid plexus epithelium with more modest sub‐pial and meningeal staining. Bar = 1 mm. (B) High power image of successive sections of periventricular region (“V” in ventricle) of D1113H mice hybridized for ISG‐15 (left) and CXCL10 (right). ISG‐15 shows intense expression in the ependyma and choroid plexus (CP) along with subependymal neurons. CXCL10 expression is also intense in some portions of the ependymal lining but there are regions without staining. CXCL10 expression in the choroid plexus is limited to individual macrophages. Bar = 100 microns. (C) High power image of successive sections of periventricular region of D1113H mice hybridized for ISG‐15 (left) and CXCL10 (right). ISG‐15 shows intense expression of the ependyma and subependymal neurons. CXCL10 expression in ependyma is more limited. Bar = 100 microns. (D) High power image of successive sections of subpial cortical region of D1113H mice (brain surface labeled “S”) hybridized for ISG‐15 (left) and CXCL10 (right). ISG‐15 shows intense expression in a focus of superficial neurons while CXCL10 expression in the successive section shows intense expression in the same focus but not in neurons but rather cells with morphology consistent with microglia. Bar = 100 microns. (E) Higher power of D demonstrating the neuronal morphology of the ISG‐15 positive cells and the microglial morphology of the CXCL10 positive cells. Bar = 20 microns. (F) High power of successive images of choroid plexus showing intense hybridization of ISG‐15 (left) in epithelia cells compared to intense hybridization for CXCL10 in macrophages of choroid plexus. Bar = 50 microns. (G) High power of select cortical regions hybridized for CCL5 showing discrete staining of cells with morphology consistent with endothelia. Bar = 20 microns