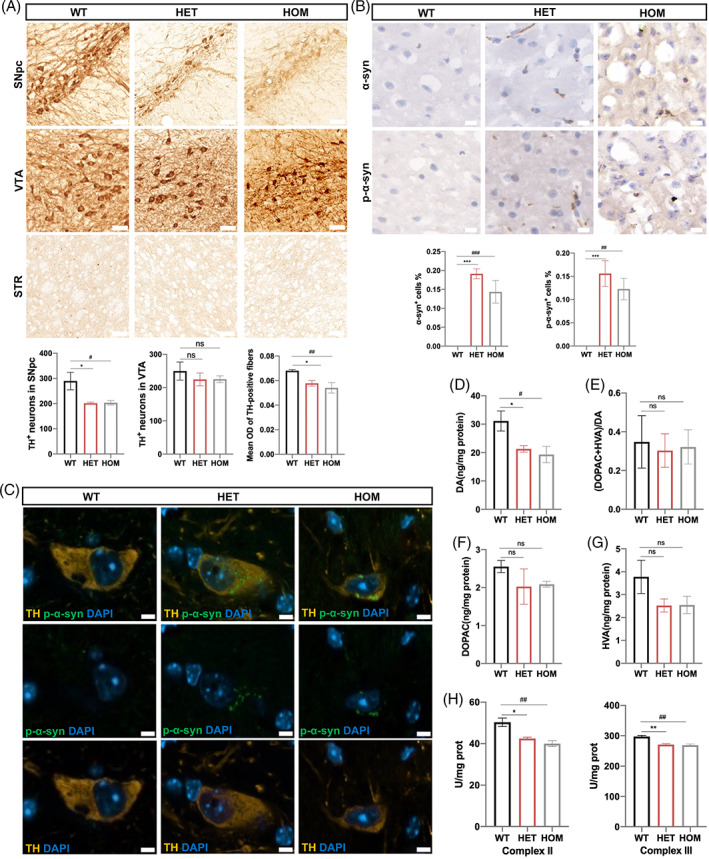
FIGURE 2.

Histopathological abnormalities in CHCHD2 p.T61I mutant mice. (A) Histological analysis of TH+ DA neurons in the SNpc and VTA, and DA nerve terminals in STR of 11‐month‐old mice (n = 5–7 per genotype). Scale bars: 50 μm. (B) Cryosections of the cerebral cortex of mice at 11 months of age were immunostained for α‐synuclein and p‐α‐synuclein (n = 3 per genotype). Scale bars: 10 μm. (C) Confocal microscopy demonstrated p‐α‐synuclein (green) aggregated in the cytoplasm of TH+ DA neuron (orange) in the SN of p.T61I mutant mice (n = 3 per genotype). Scale bars: 5 μm. (D–G) concentrations of DA (D), DA turnover rate (DOPAC+HVA/DA) (E), DOPAC (F), and HVA (G) in p.T61I mice compared with WT mice at age of 11 months (n = 3 per genotype). (H) Analysis of the activity of respiratory chain complex II and III in lumbar spinal cord of mice. (n = 3 per genotype). Data are indicated as the mean ± SEM. One‐way ANOVA was performed, followed by LSD post‐hoc testing and Tamhane T2 testing. *, **, and *** indicate p < 0.05, 0.01, and 0.001, respectively, for HET compared to WT; # and ## correspond to p < 0.05 and 0.01, respectively, for HOM compared to WT.
