FIGURE 3.

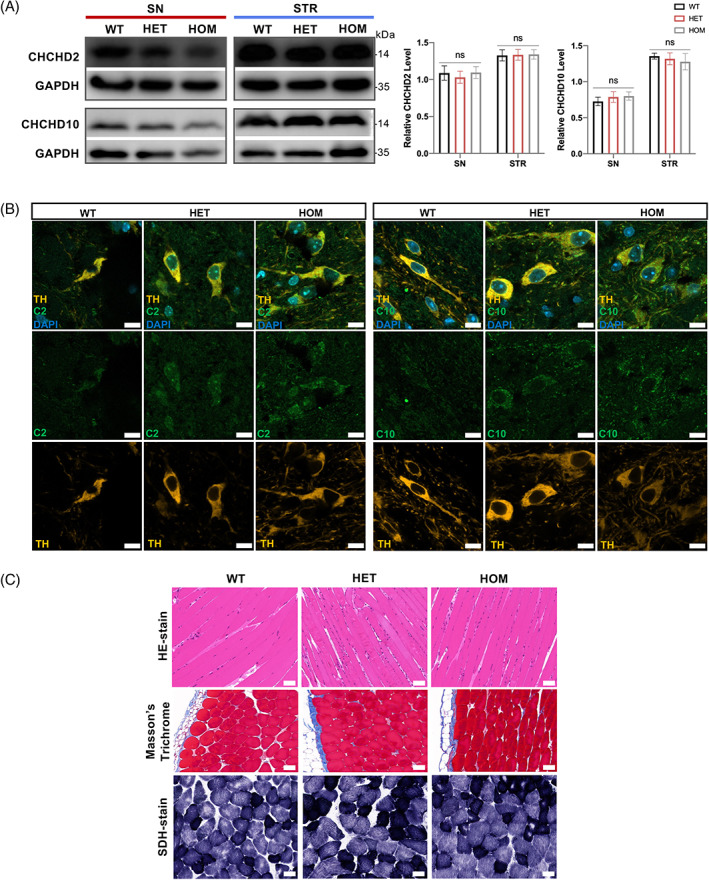
CHCHD2 and CHCHD10 aggregated in the SN of p.T61I mice. (A) Western blot analysis of brain protein homogenates with CHCHD2, CHCHD10, and GAPDH (loading control) antibodies and quantification of CHCHD2 and CHCHD10 protein levels (n = 5 per genotype). (B) Confocal microscopy demonstrated CHCHD2 (green) and CHCHD10 (green) aggregated in the cytoplasm of TH+ DA neuron (orange) in the SN of p.T61I mutant mice (n = 3 per genotype). Scale bars: 10 μm. (C) HE‐staining, Masson's trichrome, and SDH staining of the skeletal muscles (n = 5 per genotype). Scale bars: 50 μm. Data are indicated as the mean ± SEM. One‐way ANOVA was performed, followed by LSD post‐hoc testing. ns, not significant. [Correction added on 28 April 2023, after first online publication: Figure 3 has been replaced.]
