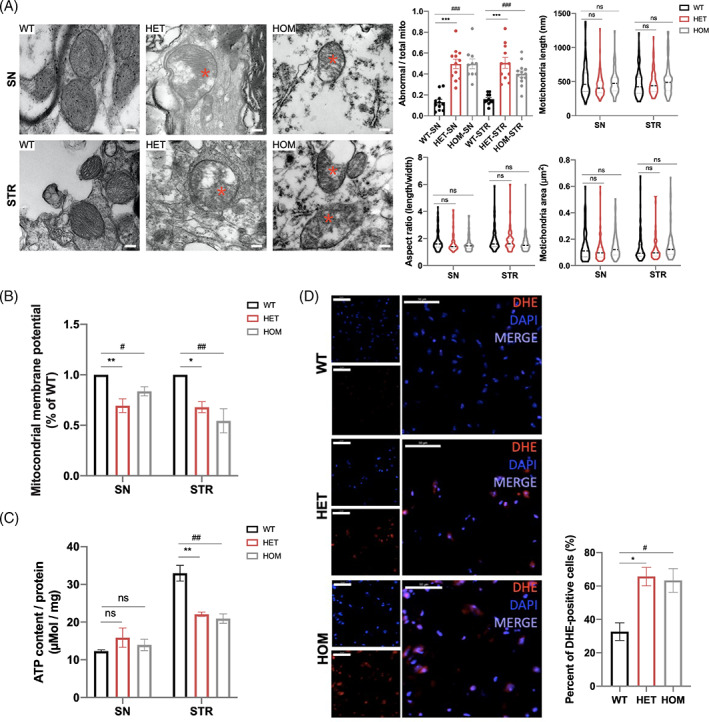
FIGURE 4.

Impaired morphology and function of mitochondria in the brains of CHCHD2 p.T61I mutant mice. (A) Electron micrographs taken in the SN and STR of 11‐month‐old mice and quantification of abnormal mitochondria (% of total mitochondria), mitochondrial length, aspect ratio, and mitochondria area (80–100 mitochondria from three mice per group). Abnormal cristae and vacuolization were visible in CHCHD2 p.T61I mutant mice. The asterisks highlight the abnormal structures in the mitochondria. Scale bars: 200 nm. (B) Mitochondrial membrane potentials of the SN and STR of 11‐month‐old mice were determined by using the JC‐1 assay (n = 3 per genotype). (C) ATP concentrations in the SN and STR of 11‐month‐old mice (n = 3 per genotype). (D) DHE staining or ROS positive cells in the STR of 11‐month‐old mice (n = 3 per genotype). Scale bars = 50 μm. Data are indicated as the mean ± SEM. One‐way ANOVA was performed, followed by LSD post‐hoc testing. *, **, and *** indicate p < 0.05, 0.01 and 0.001, respectively, for HET compared to WT; #, ##, and ### correspond to p < 0.05, 0.01 and 0.001, respectively, for HOM compared to WT. ns, not significant.
