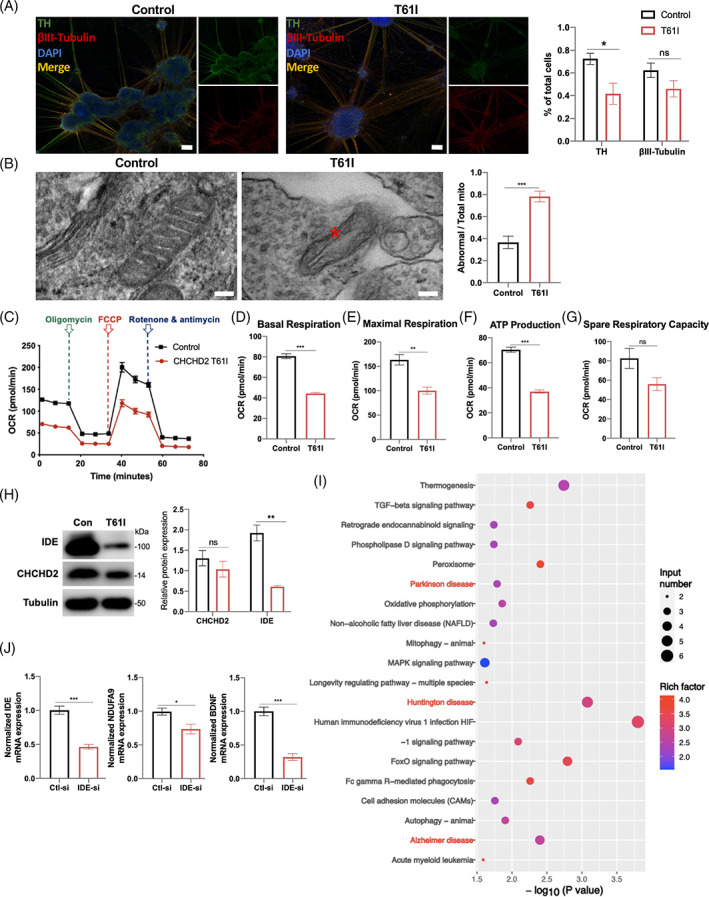
FIGURE 6.

The effect of the CHCHD2 p.T61I mutation on iPSCs‐derived DA neurons. (A) Confocal images of iPSCs‐derived DA neurons with antibodies against TH (green) and βIII‐tubulin (red), and quantification of the numbers of TH+ and βIII‐tubulin + neurons. Scale bars:100 μm. (B) Electron micrographs taken in the DA neurons and quantification of abnormal mitochondria. The asterisk highlights the abnormal structure in the mitochondria. Scale bars: 100 nm. (C) Mitochondrial OCR in control and CHCHD2 p.T61I mutant DA progenitors (mDAPs) were measured by using Seahorse‐based analysis (n = 4–5 per genotype). (D–G) Basal respiration (D), maximal respiration (E), ATP production (F), and spare respiration capacity of cell lines (G) (n = 4–5 per genotype). (H) Representative western blot image of proteins in the DA neurons and quantification of intensities of proteins, relative to β‐tubulin expression. (I) KEGG pathway analysis of down‐regulated genes in IDE‐siRNA group. (J) Differentially expressed genes in IDE‐siRNA group involved in HD, AD, and PD KEGG pathways. Data are indicated as the mean ± SEM of three independent experiments. Student's t‐test with Benjamini–Hochberg correction were performed. *, **, and *** correspond to p < 0.05, 0.01, and 0.001, respectively. ns, not significant.
