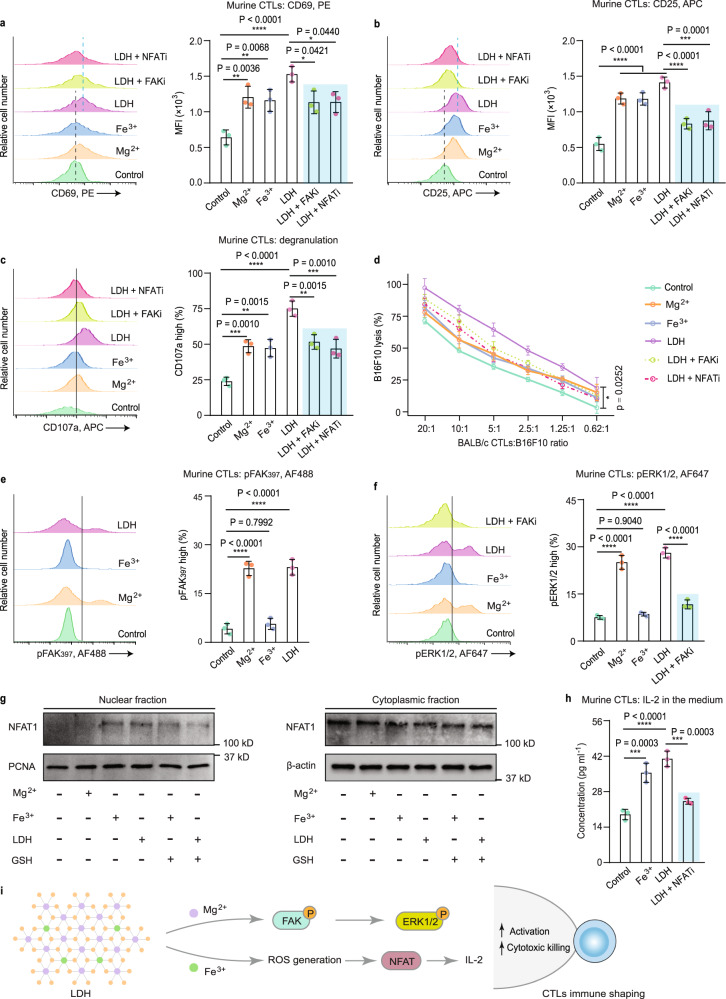
Fig. 4. In vitro activation and cytotoxicity of CTLs regulated by LDH adjuvant.
Representative histograms and quantification of the expression of the early activation marker CD69 (a), activation marker CD25 (b), and degranulation marker CD107a (c) on murine CTLs. d A 2-h killing assay of CTLs with varying ratios of BALB/c CTLs to targets (B16F10 cancer cells). Representative histograms and quantifications of the phosphorylation of FAK (e) and the phosphorylation of ERK1/2 (f); g NFAT1 (also known as NFATc2, nuclear factor of activated T cells, cytoplasmic 2) levels in nuclear and cytoplasmic fractions, investigated by Western immunoblotting. h CTL IL-2 levels in the cellular media. i Representative pathways involved in CTL immune shaping by the LDH adjuvant. For all tests, n = 3 per group. For (a–f, h), data are presented as the mean ± SD, and statistical significance was calculated via one-way ANOVA with Tukey’s multiple comparisons, *p < 0.05, **p < 0.01, ***p < 0.001, and ****p < 0.0001. Source data are provided as a Source Data file.

