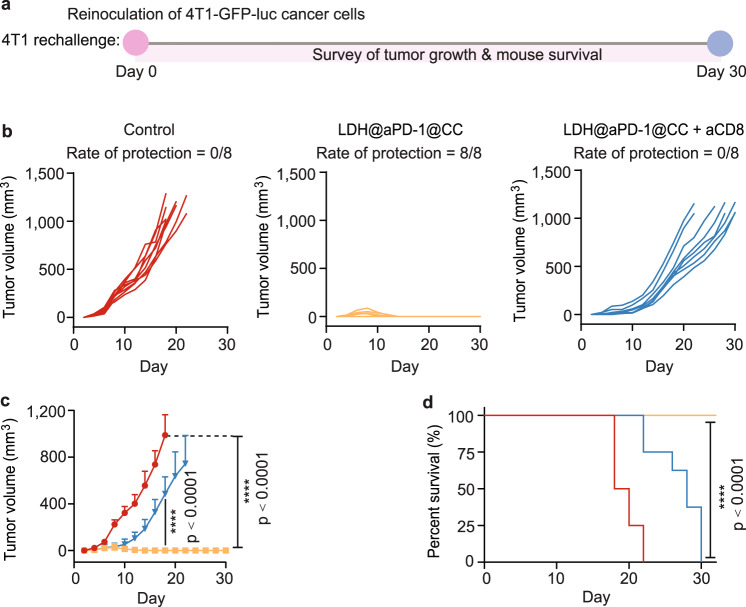
Fig. 7. 4T1-tumor rechallenging for patch-treated mice.
a Schematic illustrating the route of 4T1 tumor rechallenge assay. Apart from the control group, all tumor-free mice were harvested from Group V (LDH@aPD-1@CC). n = 8 mice per group. Individual (b) and average (c) tumor growth kinetics per group. d Survival of mice in different rechallenge groups. For (c), the curve ended when the first mouse in the corresponding group died; statistical significance was calculated via one-way ANOVA with Tukey’s multiple comparisons; data are presented as the mean ± SD. For (d), statistical significance was calculated via the log-rank (Mantel‒Cox) test by comparison with the control group. ****p < 0.0001. Source data are provided as a Source Data file.

