
Fig. 4.
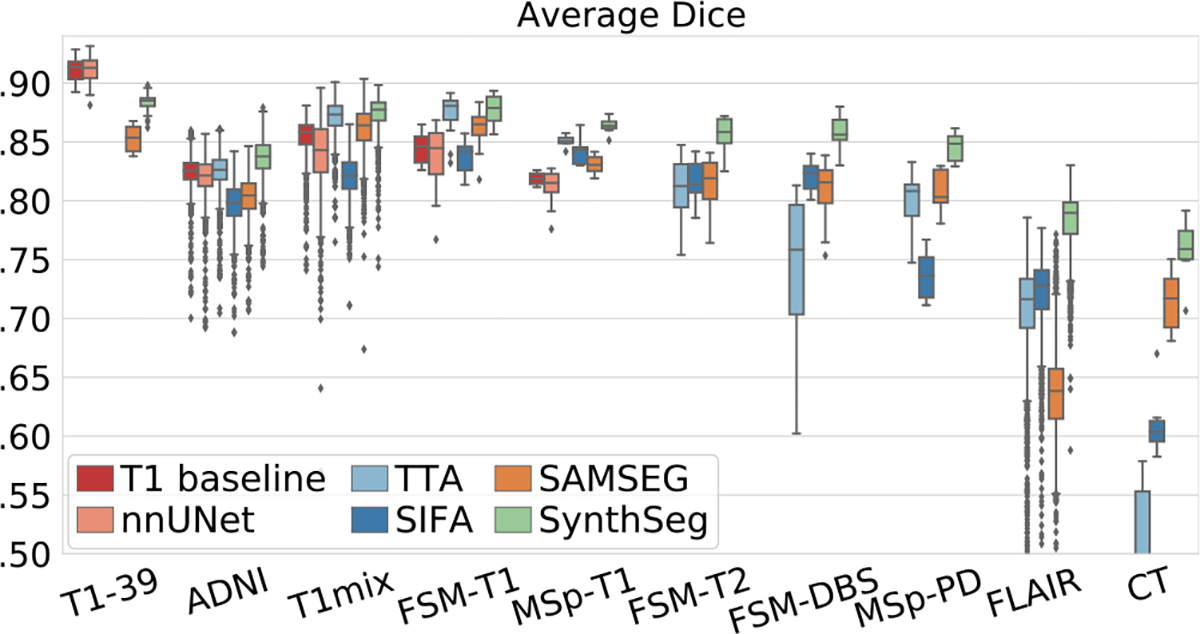
Box plots showing Dice scores obtained by all methods for every dataset. For each box, the central mark is the median; edges are the first and third quartiles; and outliers are marked with ⧫.
Official websites use .gov
A
.gov website belongs to an official
government organization in the United States.
Secure .gov websites use HTTPS
A lock (
) or https:// means you've safely
connected to the .gov website. Share sensitive
information only on official, secure websites.
Box plots showing Dice scores obtained by all methods for every dataset. For each box, the central mark is the median; edges are the first and third quartiles; and outliers are marked with ⧫.