

Abstract
Background:
Cerebral tissue integrity decline and cerebral blood flow (CBF) alteration are major aspects of motor and cognitive dysfunctions and neurodegeneration. However, little is known about the association between blood flow and brain microstructural integrity, especially in normal aging.
Purpose:
To assess the association between CBF and cerebral microstructural integrity.
Study Type:
Cross sectional.
Population:
A total of 94 cognitively unimpaired adults (mean age 50.7 years, age range between 22 and 88 years, 56 Men).
Field Strength/Sequence:
A 3 T; pseudo-continuous arterial spin labeling (pCASL), diffusion tensor imaging (DTI), Bayesian Monte Carlo analysis of multicomponent driven equilibrium steady-state observation of T1 and T2 (BMC-mcDESPOT).
Assessment:
Lobar associations between CBF derived from pCASL, and longitudinal relaxation rate (R1), transverse relaxation rate (R2) and myelin water fraction (MWF) derived from BMC-mcDESPOT, or radial diffusivity (RD), axial diffusivity (AxD), mean diffusivity (MD) and fractional anisotropy (FA) derived from DTI were assessed.
Statistical Tests:
Multiple linear regression models were used using the mean region of interest (ROI) values for MWF, R1, R2, FA, MD, RD, or AxD as the dependent variable and CBF, age, age2, and sex as the independent variables. A two-sided P value of <0.05 defined statistical significance.
Results:
R1, R2, MWF, FA, MD, RD, and AxD parameters were associated with CBF in most of the cerebral regions evaluated. Specifically, higher CBF values were significantly associated with higher FA, MWF, R1 and R2, or lower MD, RD and AxD values.
Data Conclusion:
These findings suggest that cerebral tissue microstructure may be impacted by global brain perfusion, adding further evidence to the intimate relationship between cerebral blood supply and cerebral tissue integrity.
Evidence Level:
4
Technical Efficacy:
Stage 4
Postmortem and in vivo studies have shown that cerebral degeneration is among the main sequelae of aging and may be associated with concomitant motor and cognitive declines, as well as being closely linked to several age-associated neurodegenerative pathologies and dementias.1,2 Among the numerous age-related alterations observed in the brain parenchyma, myelin breakdown, synaptic loss, and axonal damage have been shown to be biological hallmarks of various neurodegenerative diseases, such as multiple sclerosis and dementias.3,4 However, the mechanisms and risk factors underlying these cerebral microstructural changes remain poorly understood. Therefore, to characterize these changes, especially those occurring with normal aging and in the absence of clinically detectable neuropathology, it is important to identify alterations that originate from neuropathological processes.
Neurogenesis, neurorepair and regeneration of brain tissue are energy-demanding processes, and consequently potentially susceptible to deficits in perfusion.5,6 It is well established that the brain uses more energy than any other human organ, accounting for up to 20% of the body’s total usage. Consequently, cerebral tissue requires a constant and substantial influx of energy, so the flow of blood must be precisely choreographed to ensure that oxygen, glucose, and essential nutrients are delivered as needed. Indeed, a direct correlation between brain activity and blood flow has been well-established using MRI and positron emission tomography imaging technologies, suggesting that neuronal firing is systematically accompanied by increased blood flow to active areas of the brain.7 Furthermore, sufficient blood supply to the brain is critical not only for supplying nutrients, oxygen and glucose to the cerebral tissue but also for the clearance of metabolic by-products and neurotoxins, such as iron aggregates and protein-based plaques, which are known to cause neuronal damage. Therefore, it is expected that a decline in cerebral blood flow (CBF) may lead to microstructural deteriorations of cerebral tissues. Surprisingly, despite the accumulating clinical evidence of the association between deficits in CBF and cerebral tissue deterioration in various neurodegenerative diseases (such as Parkinson’s, Alzheimer’s, and multiple sclerosis),8,9 this relationship has received little attention in the context of normative aging. Examining this relationship in cohorts of cognitively unimpaired subjects is paramount to understand the pathophysiological underpinnings of these mechanisms and to inform future studies of neurodegeneration and disease progression.
Only a few MRI-based studies have examined the association between CBF and cerebral microstructural integrity in cognitively unimpaired participants.10–12 Using diffusion tensor imaging (DTI) indices of fractional anisotropy (FA), and radial and axial diffusivities (RD and AxD), sensitive metrics of water mobility and microstructure, and arterial spin labeling (ASL) to measure CBF, Chen et al showed that lower cortical CBF values were associated with lower FA or higher RD and AxD values, indicating deterioration of microstructural tissue integrity in a cohort of 105 subjects.10 Using DTI and ASL, Giezendanner et al found an association between lower subcortical CBF and lower microstructural integrity of specific gray matter (GM) regions and white matter (WM) tracts in a cohort of 43 subjects.11 In a recent study,12 Bouhrara et al demonstrated a relationship between advanced relaxometry MRI metrics, including myelin water fraction (MWF), a surrogate of myelin content, and cortical and subcortical CBF in a cohort of 67 adult participants. These studies collectively provide evidence for a potential relationship between brain perfusion and cerebral tissue health. However, they were conducted on limited study cohorts, specific tissue regions (WM or GM), or limited MR techniques and methodology. Therefore, further studies on larger cohorts and using complementary MR methodologies are still needed to further inform this potential direct link between neurovascular physiology and cerebral tissue integrity throughout normative aging, and to identify potential therapeutic strategies.
CBF can be quantified noninvasively using arterial spin labeling (ASL) perfusion MRI.13 ASL uses arterial blood water protons labeled by radiofrequency pulses as an endogenous tracer. CBF is derived from the difference between a label and a control image. Multiple image pairs are required to increase the signal-to-noise ratio.13 The longitudinal (R1) and transverse (R2) relaxation rates, as well as the DTI measures of FA, MD, RD and AxD, have been demonstrated to represent sensitive probes of tissue composition, water mobility, and microstructural integrity. Indeed, while R1, FA and RD have shown to be very sensitive to changes in myelin content, R2, AxD and MD exhibit higher sensitivity to axonal damage and changes in tissue composition including iron load.14–16 These quantitative MR metrics have been extensively used to study brain maturation and degeneration and are now incorporated in most clinical investigations.17,18 Further, in an effort to improve the measurement specificity of myelin content, multicomponent relaxometry methods have been introduced to measure MWF, which has been histologically validated as a direct proxy of myelin content.19,20 Therefore, combining these conventional and advanced quantitative MRI metrics will provide complementary insights into the underlying changes in tissue microstructure and composition.
The overarching goal of this work is to further establish and characterize the relationships between CBF and brain microstructural integrity in normative aging. Using a multiple linear regression model, we examined the regional association between CBF, derived from the whole brain, and relaxometry (R1, R2, and MWF) or diffusion (FA, MD, RD, and AxD) parameters, derived from the whole brain or the cerebral lobes, while accounting for the effect of age and sex.
Materials and Methods
Study Cohort
This study protocol from where the data was drawn was performed in compliance with our local Institutional Review Board, and all subjects provided written informed consent. After the exclusion of seven participants with imaging data exhibiting prominent motion artifacts, the final study cohort consisted of 94 cognitively unimpaired participants (mean age 50.7 ± 19.2 years, 38 women, age range between 22 and 88 years), drawn from two ongoing healthy aging cohorts at the National Institute on Aging (the Baltimore Longitudinal Study of Aging [BLSA],21,22 and the Genetic and Epigenetic Signatures of Translational Aging Laboratory Testing [GESTALT]) to evaluate multiple biomarkers related to aging. The inclusion and exclusion criteria for these two cohorts are identical. Exclusion criteria included dementia, stroke, bipolar illness, epilepsy, severe cardiac disease, severe pulmonary disease, metastatic cancer, and metallic implants or major neurologic or medical disorders. Participants underwent a battery of cognitive tests and those with cognitive impairment were excluded.
MRI Protocol
MRI experiments were performed on a 3 T whole body Philips MRI system (Achieva, Best, The Netherlands) using the internal quadrature body coil for transmission and an eight-channel phased-array head coil for reception. For each participant, the imaging protocol consisted of:
Pseudo-continuous ASL (pCASL) for CBF mapping23: Control, labeled and proton density (PD) images were acquired with background suppression using an echo-planar imaging (EPI) readout, a labeling duration of 1.8 seconds, postlabeling delay of 2 seconds, and 30 signal averages. Imaging parameters were a field-of-view of 220 mm × 210 mm × 120 mm, a spatial resolution of 2.5 mm × 2.5 mm × 5 mm, echo-time (TE) of 15 msec, repetition time (TR) of 7.5 seconds. The total acquisition time was ~12 minutes. Other details of this protocol can be found in the literature.24 A whole-brain CBF map was then generated from the pCASL dataset using the NESMA-ASL analysis to improve accuracy and precision in CBF determination.23,24
Bayesian Monte Carlo analysis of multicomponent driven equilibrium steady-state observation of T1 and T2 (BMC-mcDESPOT) for R1, R2, and MWF mapping.25 This protocol included 3D spoiled gradient recalled echo (SPGR), 3D balanced steady-state free precession (bSSFP), and 3D fast spin-echo sequences. SPGR images were acquired with flip angles (FAs) of [2 4 6 8 10 12 14 16 18 20]°, TE of 1.37 msec, and TR of 5 msec. 3D bSSFP images were acquired with FAs of [2 4 7 11 16 24 32 40 50 60]°, TE of 2.8 msec, TR of 5.8 msec, and radiofrequency excitation pulse phase increments of 0 or π to account for off-resonance effects. All SPGR and bSSFP images were acquired with an acquisition matrix of 150 × 130 × 94 and voxel size of 1.6 mm × 1.6 mm × 1.6 mm. To correct for excitation radio frequency inhomogeneity, the double-angle method (DAM)26 was used with two 3D fast spin-echo images acquired with FAs of 45° and 90°, TE of 102 msec, TR of 3000 msec, and acquisition voxel size of 2.6 mm × 2.6 mm × 4 mm. All SPGR, bSSFP, and DAM images were acquired with field-of-view of 240 mm × 208 mm × 150 mm. The total acquisition time was ~21 minutes. A whole-brain MWF map was generated from each SPGR, bSSFP, and DAM dataset using the BMC-mcDESPOT analysis. Briefly, a two-component system is assumed consisting of a slowly relaxing and a more rapidly relaxing component. The rapidly relaxing component corresponds to the signal of water trapped within the myelin sheaths while the slowly relaxing component corresponds to intracellular and extracellular water. Analysis was performed explicitly accounting for nonzero TE as incorporated into the TE-corrected-mcDESPOT signal model.27 Additionally, a whole-brain R1 map was generated from the SPGR and DAM datasets using the DESPOT1 analysis assuming a monocomponent signal model, and a whole-brain R2 map was generated from the bSSFP and DAM datasets using the DESPOT2 analysis assuming a monocomponent signal model.28
DTI for FA, MD, RD, and AxD mapping. This protocol consisted of diffusion-weighted images (DWI) acquired with single-shot EPI, TR of 10 seconds, TE of 70 msec, two b-values of 0 and 700 sec/mm2, with the latter encoded in 32 directions, acquisition matrix of 120 × 104 × 75, and acquisition voxel size of 2 mm × 2 mm × 2 mm. All images were acquired with a field-of-view of 240 mm × 208 mm × 150 mm. The total acquisition time was ~6 minutes. The DWI were corrected for eddy current and motion effects using affine registration tools implemented in FSL (Version 6.0, FMRIB, Oxford, UK)29 and registered to the DWI obtained with b = 0 sec/mm2 using FNIRT. We used the DTIfit tool implemented in FSL to calculate the eigenvalue maps used to compute FA, RD, MD, and AxD metrics.29
Registration
The scalp, ventricles, and other nonparenchymal regions within the images were eliminated using the BET tool as implemented in FSL.29 The SPGR image averaged over FAs for each participant was registered using nonlinear registration (FNIRT in FSL, Version 6.0; FMRIB, Oxford, UK) to the Montreal Neurological Institute (MNI) standard space image and the derived transformation matrix was then applied to the corresponding R1, R2, and MWF maps. Similarly, the DWI obtained at b = 0 sec/mm2 was nonlinearly registered to the MNI atlas and the calculated transformation matrix was then applied to the corresponding FA, RD, MD, and AxD maps. Additionally, the PD image was nonlinearly registered to the MNI space and the computed transformation matrix was applied to the corresponding CBF map.
Segmentation
Six WM and GM structures were chosen as regions-of-interest (ROIs) from the MNI atlas provided in FSL. These WM and GM regions encompass the whole brain (WB), frontal lobes (FL), occipital lobes (OL), parietal lobes (PL), temporal lobes (TL), and cerebellum (CRB). All ROIs were eroded to reduce partial volume effects, imperfect image registration, and to mitigate structural atrophy seen especially at older ages using a kernel box of 2 voxels × 2 voxels × 2 voxels. For each ROI and participant, the mean CBF, MWF, R1, R2, FA, MD, RD, and AxD values were calculated.
Statistical Analysis
To investigate CBF effect on MWF, R1, R2, FA, MD, RD and AxD, a multiple linear regression model was evaluated for each ROI using the mean ROI values for MWF, R1, R2, FA, MD, RD or AxD as the dependent variable and CBF, age and sex as the independent variables. A quadratic age term (age2) was incorporated in this model as several prior studies have demonstrated inverted U-shape trends of the relaxometry and DTI measures across the lifespan.30,31 Statistical analysis was conducted using the fitlm function as implemented in the MATLAB software 2021a (MathWorks, Natick, MA, USA). The value of P < 0.05 was considered statistically significant while P < 0.1 was considered as close to significance. Due to the exploratory nature of this study and concerns about type 2 errors, the P values were uncorrected for multiple comparisons.
Results
Study Cohort Characteristics
After the exclusion of seven participants with imaging data exhibiting prominent motion artifacts assessed using visual inspection, the final study cohort consisted of 94 cognitively unimpaired participants (mean age 50.7 ± 19.2 years, 38 women, age range between 22 and 88 years). We note that the effect of age was not significantly different between men and women (P = 0.22). All participants underwent the pCASL protocol for CBF imaging, while 89 over 94 subjects (age 50.9 ± 19.0 years, 34 women) underwent the BMC-mcDESPOT imaging protocol for MWF, and R1 and R2 imaging, and 84 over 94 subjects (age 50.2 ± 19.0 years, 33 women) underwent our DTI imaging protocol for FA, MD, RD and AxD imaging. We note that, for each parti all images were acquired in the same scan session. A detailed description of the cohort is presented in Table 1 and Fig. 1.
TABLE 1.
Cohort Characteristics for Each MR Modality
| Age (years) | Sex | |||
|---|---|---|---|---|
| Range | Mean ± SD | Men | Women | |
| Relaxometry (MWF, R1, R2) | 22–88 | 50.9 ± 19.0 | 54 | 34 |
| DTI (FA, MD, RD, AxD) | 22–88 | 50.2 ± 19.0 | 51 | 33 |
| ASL (CBF) | 22–88 | 50.7 ± 19.2 | 56 | 38 |
For each modality, age was not significantly different between men and women.
SD = standard deviation; MWF = myelin water fraction; R1 = longitudinal relaxation rate; R2 = transverse relaxation rate; DTI = diffusion tensor imaging; FA = fractional anisotropy, MD = mean diffusivity; RD = radial diffusivity; AxD = axial diffusivity; ASL = arterial spin labeling; CBF = cerebral blood flow.
FIGURE 1:
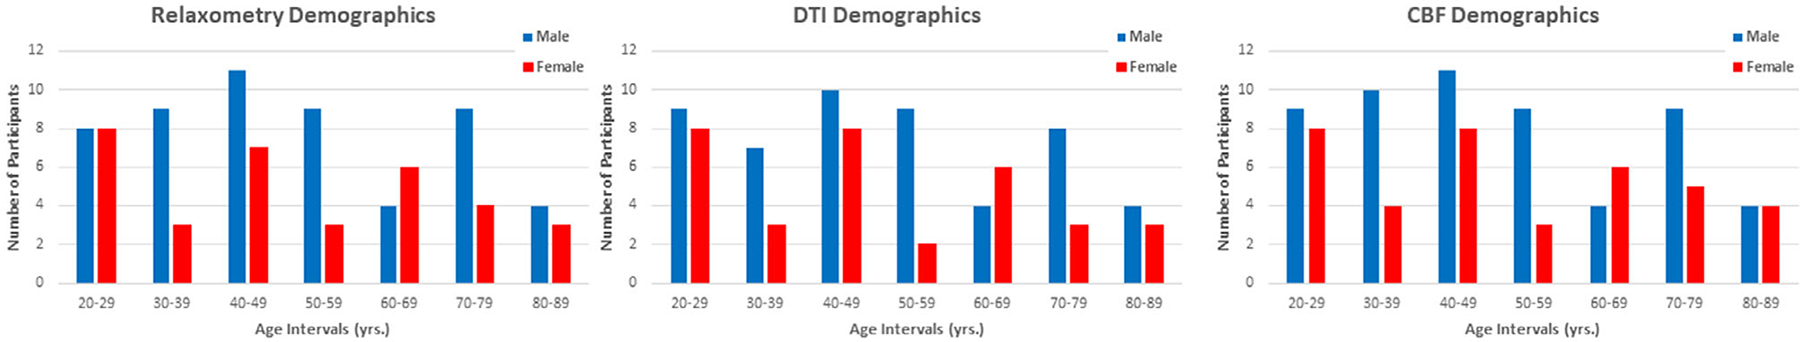
Number of participants per age decade and sex for each MR modality. CBF = cerebral blood flow; DTI = diffusion tensor imaging.
Association Between CBF and Relaxometry Metrics
Figure 2 shows representative regression plots of the relaxometry metrics (MWF, R1 and R2) derived from the whole brain (WB) WM or GM ROIs as a function of WB GM CBF. Visual inspection indicates that higher CBF is associated with higher MWF, R1 or R2 values, with the best-fit lines depicting regional variation (Supplementary Figs. S1–S3). Table 2 presents significant or close to significant associations between CBF and MWF in all ROIs studied except for the cerebellum GM. For R1, there was a statistically significant or close to significant effect of CBF in most regions except for the cerebellum GM, the FL GM and WM, the TL WM and the WB WM. For R2, there was a statistically significant or close to significant effect of CBF in most ROIs except for the TL WM and FL GM. Finally, as expected, the effect of age on all relaxometry metrics was significant or close to significance for all brain regions evaluated. Similarly, the quadratic effect of age (age2) on all relaxometry metrics was significant or close to significance in all regions (Table 2).
FIGURE 2:
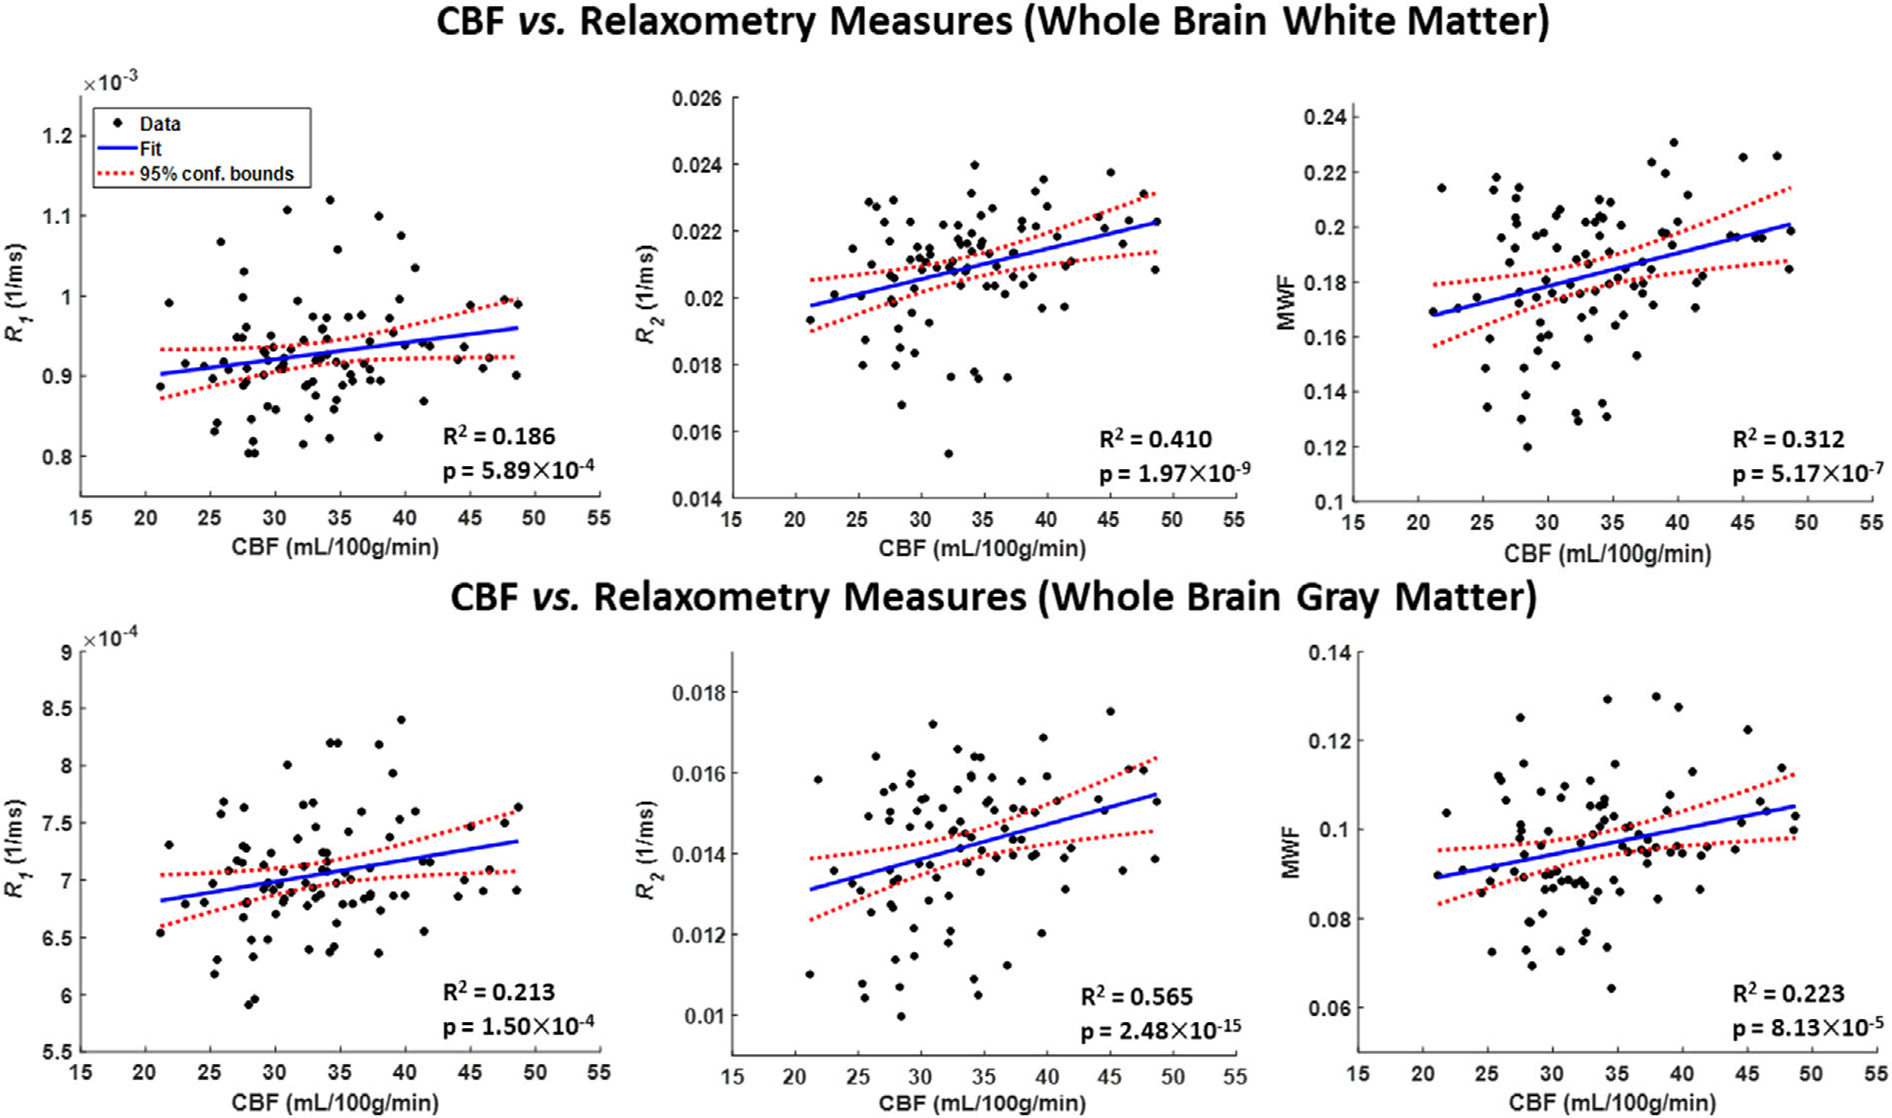
Representative regression plots of myelin water fraction (MWF), longitudinal relaxation rate (R1) or transverse relaxation rate (R2) metrics with cerebral blood flow (CBF). Results are shown for the whole brain white matter (WB WM) and gray matter (WB GM) regions of interest (ROIs). The coefficient of determination, R2, of the multiple linear regression model is reported. All associations were significant. All ROIs exhibited significant positive correlations between MWF, R1 or R2, and CBF.
TABLE 2.
P-values and Regression Coefficients, β (standard errors [SE]) for All WM and GM Structures and For All Relaxometry Parameters
| WB WM | FL WM | OL WM | PL WM | TL WM | CRB WM | WB GM | FL GM | OL GM | PL GM | TL GM | CRB GM | ||
|---|---|---|---|---|---|---|---|---|---|---|---|---|---|
| R 1 | P age | 0.0118 | 0.0069 | 0.0558 | 0.0234 | 0.0205 | 0.0217 | 0.007 | 0.0041 | 0.0371 | 0.0255 | 0.0443 | 0.0786 |
| βage (SE) × 10−6 | 5.58 (2.17) | 6.15 (2.22) | 4.41 (2.27) | 5.41 (2.35) | 5.28 (2.24) | 5.39 (2.31) | 4.28 (1.55) | 6 (2.04) | 3.65 (1.72) | 4.15 (1.82) | 3.36 (1.64) | 3.11 (1.75) | |
| P age 2 | 0.0034 | 0.0019 | 0.0287 | 0.0067 | 0.0059 | 0.0113 | 0.0019 | <0.001 | 0.0121 | 0.0064 | 0.0191 | 0.0517 | |
| βage2 (SE) × 10−8 | −6.1 (2.02) | −6.63 (2.07) | −4.73 (2.12) | −6.08 (2.19) | −5.9 (2.09) | −5.57 (2.15) | −4.66 (1.45) | −6.54 (1.91) | −4.14 (1.61) | −4.77 (1.71) | −3.68 (1.54) | −3.23 (1.64) | |
| P CBF | 0.1875 | 0.3467 | 0.0619 | 0.053 | 0.4612 | 0.0354 | 0.069 | 0.6168 | 0.0632 | 0.0795 | 0.0431 | 0.2054 | |
| βCBF (SE) × 10−6 | 1.43 (1.08) | 1.04 (1.10) | 2.14 (1.13) | 2.29 (1.17) | 0.82 (1.11) | 2.45 (1.15) | 1.44 (0.78) | 0.51 (1.03) | 1.63 (0.87) | 1.63 (0.92) | 1.7 (0.83) | 1.12 (0.88) | |
| R 2 | P age | 0.0064 | 0.0065 | 0.0034 | 0.0066 | 0.0264 | 0.0436 | <0.001 | 0.0027 | 0.0021 | 0.0081 | 0.0013 | 0.0281 |
| βage (SE) × 10−4 | 1.29 (0.46) | 1.26 (0.45) | 1.76 (0.58) | 1.45 (0.52) | 1.2 (0.53) | 1.28 (0.62) | 1.4 (0.40) | 1.44 (0.47) | 1.66 (0.52) | 1.44 (0.53) | 1.49 (0.45) | 0.97 (0.44) | |
| P age 2 | <0.001 | <0.001 | <0.001 | <0.001 | 0.0037 | 0.0142 | <0.001 | <0.001 | <0.001 | <0.001 | <0.001 | 0.0019 | |
| βage2 (SE) × 10−6 | −1.6 (0.43) | −1.6 (0.42) | −1.94 (0.54) | −1.8 (0.48) | −1.48 (0.50) | −1.46 (0.58) | −1.84 (0.38) | −2.06 (0.44) | −2.03 (0.49) | −2.03 (0.50) | −1.89 (0.42) | −1.31 (0.41) | |
| P CBF | 0.0256 | 0.0195 | 0.0443 | 0.0014 | 0.1202 | 0.0742 | 0.0342 | 0.2345 | 0.0285 | 0.0015 | 0.0133 | 0.0931 | |
| βCBF (SE) × 10−5 | 5.45 (2.40) | 5.55 (2.33) | 6.18 (3.02) | 8.92 (2.69) | 4.33 (2.75) | 5.84 (3.23) | 4.36 (2.03) | 2.81 (2.35) | 5.85 (2.63) | 8.76 (2.68) | 5.71 (2.26) | 3.73 (2.20) | |
| MWF | P age | 0.0038 | 0.0038 | 0.0024 | 0.0049 | 0.0092 | 0.0194 | <0.001 | <0.001 | <0.001 | 0.0036 | 0.0005 | 0.0235 |
| βage (SE) × 10−4 | 21.98 (7.39) | 22.88 (7.69) | 27.99 (8.93) | 24.26 (8.40) | 20.57 (7.72) | 20.07 (8.42) | 14.77 (4.21) | 16.92 (4.62) | 23.06 (6.38) | 16.74 (5.59) | 16.26 (4.51) | 8.84 (3.83) | |
| P age 2 | <0.001 | <0.001 | <0.001 | <0.001 | 0.0015 | 0.0072 | <0.001 | <0.001 | <0.001 | 0.0012 | <0.001 | 0.0301 | |
| βage2 (SE) × 10−5 | −2.52 (0.69) | −2.68 (0.72) | −2.89 (0.84) | −2.73 (0.79) | −2.37 (0.72) | −2.17 (0.79) | −1.49 (0.39) | −1.76 (0.43) | −2.23 (0.60) | −1.76 (0.52) | −1.64 (0.42) | −0.79 (0.36) | |
| P CBF | 0.0238 | 0.0081 | 0.0239 | 0.002 | 0.0683 | 0.0138 | 0.0176 | 0.0406 | 0.0182 | 0.0037 | 0.0143 | 0.2935 | |
| βCBF (SE) × 10−4 | 8.57 (3.72) | 10.5 (3.87) | 10.35 (4.50) | 13.47 (4.23) | 7.18 (3.89) | 10.67 (4.24) | 5.13 (2.12) | 4.84 (2.33) | 7.74 (3.21) | 8.41 (2.82) | 5.68 (2.27) | 2.04 (1.93) |
Sex results were not reported as it exhibited nonsignificant effects. Bold indicates statistical significance (P < 0.05) while bold-italic indicates close-to-significance (P < 0.1).
WB = whole brain; FL = frontal lobes; OL = occipital lobes; PL = parietal lobes; TL = temporal lobes; CRB = cerebellum; WM = white matter; GM = gray matter; CBF = cerebral blood flow; MWF = myelin water fraction; R1 = longitudinal relaxation rate; R2 = transverse relaxation rate.
Association Between CBF and Diffusion Indices
Figure 3 shows the DTI indices (FA, MD, RD, and AxD) derived from the WB WM or GM ROIs as a function of CBF. Visual inspection indicates that higher CBF is associated with higher FA, or with lower MD, RD and AxD, with best-fit lines displaying regional variations (Supplementary Figs. S4–S7). Table 3 presents significant or close to significant associations between CBF and FA in the OL GM, as well as the CRB GM and PL GM. For MD, there was a statistically significant or close to significant effect of CBF in most regions except for the TL GM and WM and the CRB WM. For RD, there was a statistically significant or close to significant effect of CBF in approximately half of the observed regions. For AxD, most ROIs exhibited statistically significant effects except for the CRB WM and GM. Furthermore, the effect of age on MD, RD and AxD were significant or close to significance in all regions except the CRB WM and OL GM and OL WM (MD and AxD only). However, the effect of age on FA was significant in limited regions. The quadratic effect of age, age2, was significant or close to significance in all brain regions except the CRB WM for all metrics and the OL GM (FA only).
FIGURE 3:
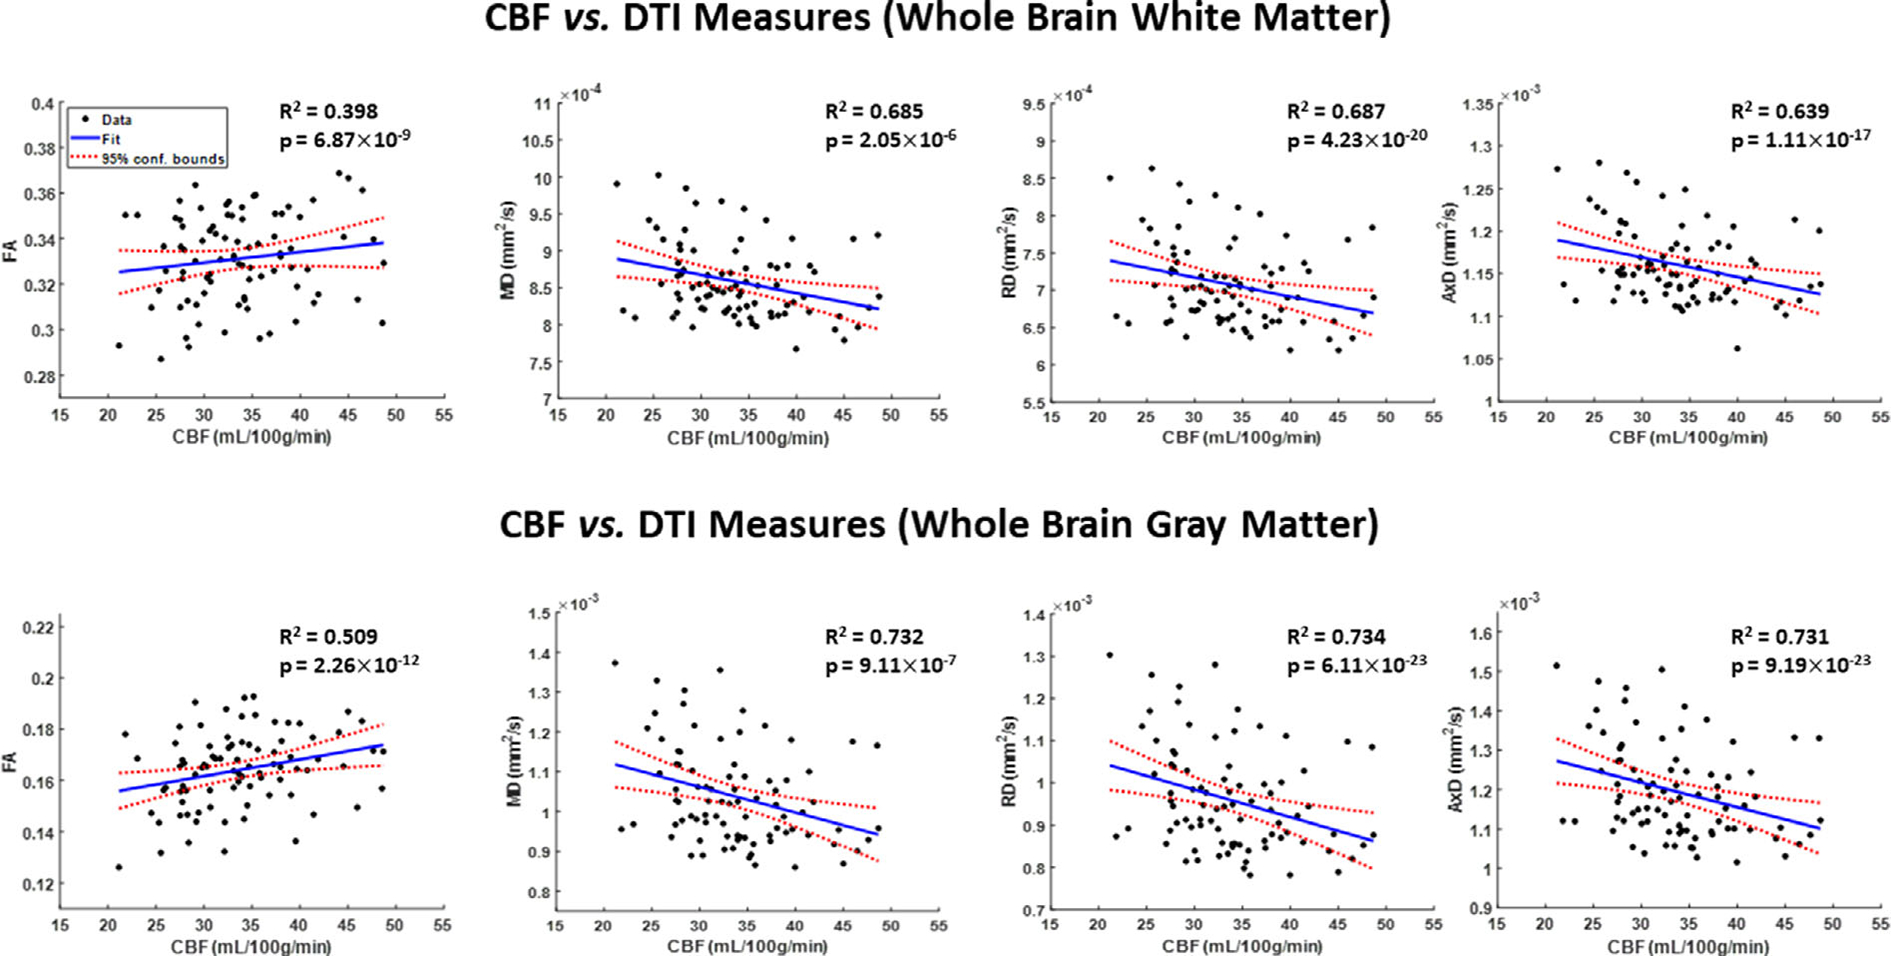
Representative regression plots of the DTI indices of fractional anisotropy (FA), mean diffusivity (MD), radial diffusivity (RD) and axial diffusivity (AxD) with cerebral blood flow (CBF). Results are shown for the whole brain white matter (WB WM) and gray matter (WB GM) regions of interests (ROIs). The coefficient of determination, R2, of the multiple linear regression model is reported. All associations were significant. All diffusivity indices exhibited significant negative correlations with CBF, while the FA exhibited positive correlations with CBF.
TABLE 3.
P Values and Regression Coefficients, β (standard errors [SE]) for All WM and GM Structures and for Each DTI Parameter Studied
| WB WM | FL WM | OL WM | PL WM | TL WM | CRB WM | WB GM | FL GM | OL GM | PL GM | TL GM | CRB GM | ||
|---|---|---|---|---|---|---|---|---|---|---|---|---|---|
| FA | P age | 0.1394 | 0.5028 | 0.0959 | 0.1625 | 0.3379 | 0.1276 | 0.0441 | 0.0167 | 0.3964 | 0.1688 | 0.1092 | 0.0229 |
| βage (SE) × 10−4 | 8.32 (5.57) | 3.94 (5.86) | 9.84 (5.84) | 8.35 (5.93) | 7.6 (7.89) | 14.98 (9.73) | 7.66 (3.74) | 9.47 (3.87) | −3.21 (3.77) | 5.86 (4.22) | 5.76 (3.56) | 12.11 (5.22) | |
| P age 2 | 0.0105 | 0.0454 | 0.0318 | 0.0107 | 0.051 | 0.1695 | 0.0012 | <0.001 | 0.6667 | 0.0149 | 0.011 | 0.0017 | |
| βage2 (SE) × 10−5 | −1.37 (0.52) | −1.12 (0.55) | −1.2 (0.55) | −1.46 (0.56) | −1.47 (0.74) | −1.27 (0.91) | −1.19 (0.35) | −1.52 (0.36) | 0.15 (0.35) | −0.99 (0.40) | −0.87 (0.33) | −1.59 (0.49) | |
| P CBF | 0.9423 | 0.4729 | 0.9459 | 0.7029 | 0.3734 | 0.2534 | 0.114 | 0.1919 | 0.029 | 0.0262 | 0.2777 | 0.0604 | |
| βCBF (SE) × 10−4 | 0.2 (2.82) | 2.14 (2.97) | 0.2 (2.96) | −1.15 (3.00) | −3.58 (4.00) | 5.67 (4.93) | 3.03 (1.90) | 2.58 (1.96) | 4.24 (1.91) | 4.84 (2.14) | 1.97 (1.80) | 5.04 (2.64) | |
| MD | P age | 0.002 | 0.0147 | 0.1348 | 0.0145 | 0.0153 | 0.1122 | 0.0023 | 0.0102 | 0.1816 | 0.0609 | 0.0007 | 0.0031 |
| βage (SE) × 10−6 | −3.37 (1.05) | −2.9 (1.16) | −2.33 (1.54) | −4.92 (1.97) | −2.82 (1.14) | −2.26 (1.41) | −7.34 (2.33) | −8.77 (3.33) | −3.2 (2.37) | −6.83 (3.59) | −7.09 (2.00) | −6.76 (2.22) | |
| P age 2 | <0.001 | <0.001 | 0.0074 | <0.001 | <0.001 | 0.1144 | <0.001 | <0.001 | 0.005 | <0.001 | <0.001 | <0.001 | |
| βage2 (SE) × 10−8 | 5.07 (0.99) | 4.69 (1.09) | 3.99 (1.45) | 7.74 (1.85) | 4.25 (1.08) | 2.12 (1.33) | 11.64 (2.19) | 14.62 (3.13) | 6.45 (2.23) | 12 (3.38) | 10.56 (1.88) | 8.97 (2.08) | |
| P CBF | 0.0574 | 0.0969 | 0.0541 | 0.0022 | 0.1465 | 0.4502 | 0.0178 | 0.0666 | 0.0119 | 0.001 | 0.1791 | 0.0993 | |
| βCBF (SE) × 10−6 | −1.03 (0.53) | −0.99 (0.59) | −1.53 (0.78) | −3.16 (1.00) | −0.89 (0.60) | −0.54 (0.71) | −2.85 (1.18) | −3.14 (1.69) | −3.1 (1.20) | −6.23 (1.82) | −1.37 (1.01) | −1.87 (1.12) | |
| RD | P age | 0.0036 | 0.0248 | 0.0908 | 0.0153 | 0.0242 | 0.1845 | 0.0027 | 0.0096 | 0.1997 | 0.0609 | <0.001 | 0.007 |
| βage (SE) × 10−6 | −3.41 (1.14) | −2.9 (1.27) | −2.8 (1.64) | −4.98 (2.01) | −2.94 (1.28) | −2.02 (1.51) | −7.25 (2.34) | −8.77 (3.31) | −3.12 (2.42) | −6.94 (3.65) | −6.89 (1.97) | −5.83 (2.11) | |
| P age 2 | <0.001 | <0.001 | 0.0041 | <0.001 | <0.001 | 0.1954 | <0.001 | <0.001 | 0.0066 | <0.001 | <0.001 | <0.001 | |
| βage2 (SE) × 10−7 | 0.53 (0.11) | 0.49 (0.12) | 0.45 (0.15) | 0.8 (0.19) | 0.46 (0.12) | 0.19 (0.14) | 1.16 (0.22) | 1.47 (0.31) | 0.63 (0.23) | 1.22 (0.34) | 1.05 (0.18) | 0.83 (0.20) | |
| P CBF | 0.0908 | 0.138 | 0.1045 | 0.0052 | 0.2273 | 0.1966 | 0.0165 | 0.0626 | 0.0115 | 0.0012 | 0.1491 | 0.084 | |
| βCBF (SE) × 10−4 | −0.99 (0.58) | −0.96 (0.64) | −1.36 (0.83) | −2.93 (1.02) | −0.83 (0.68) | −1 (0.76) | −2.9 (1.18) | −3.16 (1.68) | −3.16 (1.22) | −6.22 (1.85) | −1.45 (1.00) | −1.87 (1.07) | |
| AxD | P age | 0.0027 | 0.0119 | 0.3982 | 0.0183 | 0.0392 | 0.215 | 0.0025 | 0.0158 | 0.1763 | 0.0609 | 0.0159 | 0.0054 |
| βage (SE) × 10−6 | −2.98 (0.96) | −2.66 (1.03) | −1.25 (1.47) | −4.72 (1.96) | −2.32 (1.11) | −1.69 (1.35) | −7.14 (2.29) | −8.25 (3.34) | −3.15 (2.31) | −6.66 (3.51) | −4.75 (1.93) | −6.42 (2.24) | |
| P age 2 | <0.001 | <0.001 | 0.0528 | <0.001 | 0.0027 | 0.1643 | <0.001 | <0.001 | 0.0039 | <0.001 | <0.001 | <0.001 | |
| βage2 (SE) × 10−7 | 0.43 (0.09) | 0.41 (0.10) | 0.27 (0.14) | 0.71 (0.18) | 0.33 (0.10) | 0.18 (0.13) | 1.14 (0.21) | 1.39 (0.31) | 0.64 (0.22) | 1.17 (0.33) | 0.77 (0.18) | 0.85 (0.21) | |
| P CBF | 0.0181 | 0.0655 | 0.0203 | <0.001 | 0.063 | 0.7351 | 0.0199 | 0.0715 | 0.0099 | <0.001 | 0.0176 | 0.1555 | |
| βCBF (SE) × 10−6 | −1.17 (0.49) | −0.98 (0.52) | −1.76 (0.74) | −3.47 (0.99) | −1.11 (0.59) | 0.23 (0.69) | −2.75 (1.16) | −3.09 (1.69) | −3.09 (1.17) | −6.1 (1.78) | −2.34 (0.96) | −1.63 (1.14) |
Sex results were not reported as it exhibited nonsignificant effect. Bold indicates statistical significance (P < 0.05) while bold-italic indicates close-to-significance (P < 0.1).
WB = whole brain; FL = frontal lobes; OL = occipital lobes; PL = parietal lobes; TL = temporal lobes; CRB = cerebellum; WM = white matter; GM = gray matter; CBF = cerebral blood flow; FA = fractional anisotropy, MD = mean diffusivity; RD = radial diffusivity; AxD = axial diffusivity.
Discussion
Using a number of quantitative MRI measurements, on a relatively large cohort of well-characterized cognitively unimpaired adults, we demonstrate associations between lower cortical CBF and higher deterioration in cerebral microstructure throughout the brain. Importantly, these associations were observed in healthy-appearing gray matter and white matter tissues and were not entirely explained by age or sex differences. These findings expand upon the current literature, detailing a potential relationship between deficiencies in cerebral blood supply and tissue damage.10–12 Although these results do not identify CBF as a causal factor in cerebral tissue decay, they depict a strong correlation between neurovascular physiology and cerebral tissue status in normative aging, and motivate further investigations, especially longitudinal assessments, including in cohorts of cognitively impaired subjects.
Gray matter (GM) and white matter (WM) tissue deteriorations and decline in CBF are central features of several neurodegenerative diseases. Oligodendrocytes, the cells responsible for myelin synthesis in neurons, are susceptible to a myriad of intrinsic and extrinsic factors concurrent with the aging process, including degeneration due to CBF deficits as a response to chronic or acute hypoperfusion.5,6,32 Age-related disruptions in cells involved in neurovascular coupling, including cerebrovascular endothelial cells, pericytes, smooth muscle cells, astrocytes and other microglia, can lead to dysregulation of CBF and, consequently, oligodendrocyte degeneration.32 Previous work has also shown that low CBF may be a hallmark biomarker of neuroinflammation, characterized by the release of cytokines, pro-inflammatory factors and cytotoxic factors, that can induce inflammation-mediated damage to oligodendrocytes and further disrupt myelin integrity during normative aging.32 The process by which oligodendrocytes produce the insulating sheath around axons is complex and precisely timed. The maturation of oligodendrocyte precursor cells into myelin-producing oligodendrocytes depends highly on the surrounding neurochemical environment. Substances such as adenosine and Leukemia inhibitory factors (LIF) work together to promote the formation of myelin.33 Additionally, the process of myelination by oligodendrocytes has been shown to happen in a narrow window of around 12–18 hours.34 During this process, a complex host of proteins such as myelin basic protein (MBP) and proteolipid protein (PLP) must be transported and directed to specific locations along the myelin membrane. Disruption in the trafficking of these proteins may result in compromising the myelination process. Therefore, adequate supplies of oxygen, glucose and essential nutrients are paramount for a proper orchestration of these fundamental processes; these can only be ensured through an adequate regional blood flow. However, we note that the variability in the correlation between MWF and CBF also indicates that other factors are significant for myelin integrity besides CBF. Our results indicate that R2 and AxD are also associated with CBF since lower values are associated with lower CBF, which besides myelin deterioration, likely indicates that axonal or synaptic damage may occur with lower CBF. Indeed, studies have shown that the axonal energy metabolism is highly driven by glycolytic oligodendrocytes,35–37 and that the glial cells responsible for myelination preserve axonal integrity by supporting axons with the required metabolites.37 Therefore, it is conceivable that any damage to the oligodendrocytes or the myelin sheaths could lead to a subsequent degeneration of the axons.
As expected, there were significant quadratic associations between all MR parameters and age in most cerebral regions investigated. These results likely highlight the continuous maturation and development of myelin content or axonal density until middle age, followed by a decline with advanced age, in agreement with extensive previous literature.30,31 Additionally, there were no associations in any MR parameters investigated with sex. Literature regarding sexual dimorphism in cerebral microstructure remains sparse, requiring further investigations.
Limitations
The cross-sectional nature of this investigation cannot allow inferring a causal link between CBF and cerebral microstructural integrity. Longitudinal studies are still required. The results of this study, derived from a large cognitively unimpaired cohort, provide a foundation for future investigations examining patterns of tissue decay during progressive neurodegenerative disease. Further, our statistical analysis did not account for multiple comparisons due to the exploratory nature of this investigations as well as concerns regarding type 2 errors. Nevertheless, we note that although several ROIs exhibited strong and significant associations between CBF and diffusion or relaxometry parameters, this association was only close to significance in various ROIs, which could not survive multiple comparisons correction. Further, identical ASL parameters (eg postlabeling delay) were used for all subjects, assuming negligible effects of spatial variation in arterial transit time (ATT), the time of the arterial bolus to transit from the labeling plane to the imaging volume.13 However, ATT may differ between subjects due to arterial blood velocity differences,38 introducing a small bias in derived CBF values. A multiple postlabeling delay ASL technique may provide more accurate CBF quantification.38 It must also be emphasized that the determination of DTI indices in gray matter regions is challenging due to potential contamination from cerebrospinal fluid. This partial volume effect could bias estimation of DTI parameters and preclude accurate evaluation of this association, though we did careful visual inspection and erosion to minimize this effect. The use of the free-water DTI technique may provide a more accurate estimation of the DTI indices in gray matter and a better assessment of the association between CBF and GM status.39,40 Moreover, certain physiological and experimental parameters (including body mass, blood pressure, blood lipids, insulin resistance and inflammatory markers that could affect myelin content) could bias relaxation rates, MWF and DTI indices determination. A meaningful study of these variables would require a much larger cohort size than in the present study. Furthermore, DTI indices are sensitive but not specific to cerebral microstructural changes. Multiple factors can affect the DTI-derived eigenvalues from which FA, RD, AxD, and MD are derived, including myelin breakdown, axonal degeneration, hydration, temperature, flow, macromolecular content and architectural features, such as fiber fanning or crossing. Similarly, various experimental and physiological factors, which are not considered in the BMC-mcDESPOT signal models, could be involved in this discrepancy. This includes, but is not limited to, the effects of magnetization transfer between macromolecules and free water protons, exchange between water pools, J-coupling, off-resonance, spin locking, water diffusion within different compartments, and internal gradients. These represent major challenges in MRI studies of myelin content, and further technical developments are required to improve the accuracy of myelin imaging. Finally, further histological-based validation of the MWF estimates derived using BMC-mcDESPOT is required.
Conclusions
We showed in this cross-sectional study that brain blood perfusion may be significantly associated with cerebral tissue integrity, including myelin content.
Supplementary Material
Footnotes
Additional supporting information may be found in the online version of this article
REFERENCES
- 1.Roher AE, Debbins JP, Malek-Ahmadi M, et al. Cerebral blood flow in Alzheimer’s disease. Vasc Health Risk Manag 2012;8:599–611. [DOI] [PMC free article] [PubMed] [Google Scholar]
- 2.Sweeney MD, Kisler K, Montagne A, Toga AW, Zlokovic BV. The role of brain vasculature in neurodegenerative disorders. Nat Neurosci 2018;21(10):1318–1331. [DOI] [PMC free article] [PubMed] [Google Scholar]
- 3.Moll NM, Rietsch AM, Thomas S, et al. Multiple sclerosis normal-appearing white matter: Pathology-imaging correlations. Ann Neurol 2011;70(5):764–773. [DOI] [PMC free article] [PubMed] [Google Scholar]
- 4.Minkova L, Habich A, Peter J, Kaller CP, Eickhoff SB, Klöppel S. Gray matter asymmetries in aging and neurodegeneration: A review and meta-analysis. Hum Brain Mapp 2017;38(12):5890–5904. [DOI] [PMC free article] [PubMed] [Google Scholar]
- 5.Choi BR, Kim DH, Back DB, et al. Characterization of white matter injury in a rat model of chronic cerebral hypoperfusion. Stroke 2016;47(2):542–547. [DOI] [PubMed] [Google Scholar]
- 6.Cechetti F, Pagnussat AS, Worm PV, et al. Chronic brain hypoperfusion causes early glial activation and neuronal death, and subsequent long-term memory impairment. Brain Res Bull 2012;87(1):109–116. [DOI] [PubMed] [Google Scholar]
- 7.Mintun MA, Lundstrom BN, Snyder AZ, Vlassenko AG, Shulman GL, Raichle ME. Blood flow and oxygen delivery to human brain during functional activity: Theoretical modeling and experimental data. Proc Natl Acad Sci U S A 2001;98(12):6859–6864. [DOI] [PMC free article] [PubMed] [Google Scholar]
- 8.Pelizzari L, Laganà MM, Di Tella S, et al. Combined assessment of diffusion parameters and cerebral blood flow within basal ganglia in early Parkinson’s disease. Frontiers in aging. Neuroscience 2019;11(134);1–10. [DOI] [PMC free article] [PubMed] [Google Scholar]
- 9.Zhong G, Zhang R, Jiaerken Y, et al. Better correlation of cognitive function to white matter integrity than to blood supply in subjects with leukoaraiosis. Front Aging Neurosci 2017;9:185. [DOI] [PMC free article] [PubMed] [Google Scholar]
- 10.Chen JJ, Rosas HD, Salat DH. The relationship between cortical blood flow and sub-cortical white-matter health across the adult age span. PLoS One 2013;8(2):e56733. [DOI] [PMC free article] [PubMed] [Google Scholar]
- 11.Giezendanner S, Fisler MS, Soravia LM, et al. Microstructure and cerebral blood flow within white matter of the human brain: A TBSS analysis. PloS One 2016;11(3):e0150657. [DOI] [PMC free article] [PubMed] [Google Scholar]
- 12.Bouhrara M, Alisch J, Nikkita N, et al. Association of cerebral blood flow with myelin content in cognitively unimpaired adults. BMJ Neurol Open 2020;2:e000053. [DOI] [PMC free article] [PubMed] [Google Scholar]
- 13.Alsop DC, Detre JA, Golay X, et al. Recommended implementation of arterial spin labeled perfusion MRI for clinical applications: A consensus of the ISMRM perfusion study group and the European consortium for ASL in dementia. Magn Reson Med 2015;73(1):102–116. [DOI] [PMC free article] [PubMed] [Google Scholar]
- 14.Deoni SC. Quantitative relaxometry of the brain. Top Magn Reson Imaging 2010;21(2):101–113. [DOI] [PMC free article] [PubMed] [Google Scholar]
- 15.Alexander AL, Lee JE, Lazar M, Field AS. Diffusion tensor imaging of the brain. Neurotherapeutics 2007;4(3):316–329. [DOI] [PMC free article] [PubMed] [Google Scholar]
- 16.Beaulieu C The basis of anisotropic water diffusion in the nervous system - a technical review. NMR Biomed 2002;15(7–8):435–455. [DOI] [PubMed] [Google Scholar]
- 17.Tae WS, Ham BJ, Pyun SB, Kang SH, Kim BJ. Current clinical applications of diffusion-tensor imaging in neurological disorders. J Clin Neurol 2018;14(2):129–140. [DOI] [PMC free article] [PubMed] [Google Scholar]
- 18.Mancini M, Karakuzu A, Cohen-Adad J, Cercignani M, Nichols TE, Stikov N. An interactive meta-analysis of MRI biomarkers of myelin. Elife 2020;9:e61523. [DOI] [PMC free article] [PubMed] [Google Scholar]
- 19.Alonso-Ortiz E, Levesque IR, Pike GB. MRI-based myelin water imaging: A technical review. Magn Reson Med 2015;73(1):70–81. [DOI] [PubMed] [Google Scholar]
- 20.Laule C, Leung E, Lis DK, et al. Myelin water imaging in multiple sclerosis: Quantitative correlations with histopathology. Mult Scler 2006;12(6):747–753. [DOI] [PubMed] [Google Scholar]
- 21.Shock N Normal human aging: The Baltimore longitudinal study of aging. J Gerontol 1985;40(6):767. [Google Scholar]
- 22.Ferrucci L The Baltimore longitudinal study of aging (BLSA): A 50-year-long journey and plans for the future. J Gerontol A Biol Sci Med Sci 2008;63(12):1416–1419. [DOI] [PMC free article] [PubMed] [Google Scholar]
- 23.Alisch JSR, Khattar N, Kim RW, et al. Sex and age-related differences in cerebral blood flow investigated using pseudo-continuous arterial spin labeling magnetic resonance imaging. Aging (Albany NY) 2021;13(4):4911–4925. [DOI] [PMC free article] [PubMed] [Google Scholar]
- 24.Bouhrara M, Lee DY, Rejimon AC, Bergeron CM, Spencer RG. Spatially adaptive unsupervised multispectral nonlocal filtering for improved cerebral blood flow mapping using arterial spin labeling magnetic resonance imaging. J Neurosci Methods 2018;309:121–131. [DOI] [PMC free article] [PubMed] [Google Scholar]
- 25.Bouhrara M, Spencer RG. Improved determination of the myelin water fraction in human brain using magnetic resonance imaging through Bayesian analysis of mcDESPOT. Neuroimage 2016;127:456–471. [DOI] [PMC free article] [PubMed] [Google Scholar]
- 26.Stollberger R, Wach P. Imaging of the active B1 field in vivo. Magn Reson Med 1996;35(2):246–251. [DOI] [PubMed] [Google Scholar]
- 27.Bouhrara M, Spencer RG. Incorporation of nonzero echo times in the SPGR and bSSFP signal models used in mcDESPOT. Magn Reson Med 2015;74(5):1227–1235. [DOI] [PMC free article] [PubMed] [Google Scholar]
- 28.Deoni SC, Rutt BK, Peters TM. Rapid combined T1 and T2 mapping using gradient recalled acquisition in the steady state. Magn Reson Med 2003;49(3):515–526. [DOI] [PubMed] [Google Scholar]
- 29.Jenkinson M, Beckmann CF, Behrens TE, Woolrich MW, Smith SM. FSL. Neuroimage 2012;62(2):782–790. [DOI] [PubMed] [Google Scholar]
- 30.Kiely M, Triebswetter C, Cortina LE, et al. Insights into human cerebral white matter maturation and degeneration across the adult lifespan. Neuroimage 2021;247:118727. [DOI] [PMC free article] [PubMed] [Google Scholar]
- 31.Westlye LT, Walhovd KB, Dale AM, et al. Life-span changes of the human brain white matter: Diffusion tensor imaging (DTI) and volumetry. Cereb Cortex 2010;20:2055–2068. [DOI] [PubMed] [Google Scholar]
- 32.Sams EC. Oligodendrocytes in the aging brain. Neuronal Signal 2021;5(3):NS20210008. [DOI] [PMC free article] [PubMed] [Google Scholar]
- 33.Maire JC, Medilanski J, Straub RW. Release of adenosine, inosine and hypoxanthine from rabbit non-myelinated nerve fibres at rest and during activity. J Physiol 1984;357:67–77. [DOI] [PMC free article] [PubMed] [Google Scholar]
- 34.Barres BA. The mystery and magic of glia: A perspective on their roles in health and disease. Neuron 2008;60(3):430–440. [DOI] [PubMed] [Google Scholar]
- 35.Saab AS, Tzvetavona ID, Trevisiol A, et al. Oligodendroglial NMDA receptors regulate glucose import and axonal energy metabolism. Neuron 2016;91(1):119–132. [DOI] [PMC free article] [PubMed] [Google Scholar]
- 36.Mot AI, Depp C, Nave KA. An emerging role of dysfunctional axonoligodendrocyte coupling in neurodegenerative diseases. Dialogues Clin Neurosci 2018;20(4):283–292. [DOI] [PMC free article] [PubMed] [Google Scholar]
- 37.Nave KA. Myelination and support of axonal integrity by glia. Nature 2010;468(7321):244–252. [DOI] [PubMed] [Google Scholar]
- 38.Qin Q, Huang AJ, Hua J, Desmond JE, Stevens RD, van Zijl PCM. Three-dimensional whole-brain perfusion quantification using pseudo-continuous arterial spin labeling MRI at multiple post-labeling delays: Accounting for both arterial transit time and impulse response function. NMR Biomed 2014;27(2):116–128. [DOI] [PMC free article] [PubMed] [Google Scholar]
- 39.Golub M, Neto Henriques R, Gouveia NR. Free-water DTI estimates from single b-value data might seem plausible but must be interpreted with care. Magn Reson Med 2021;85(5):2537–2551. [DOI] [PubMed] [Google Scholar]
- 40.Tristán-Vega A, París G, de Luis-García R, Aja-Fernández S. Accurate free-water estimation in white matter from fast diffusion MRI acquisitions using the spherical means technique. Magn Reson Med 2022;87(2):1028–1035. [DOI] [PubMed] [Google Scholar]
Associated Data
This section collects any data citations, data availability statements, or supplementary materials included in this article.