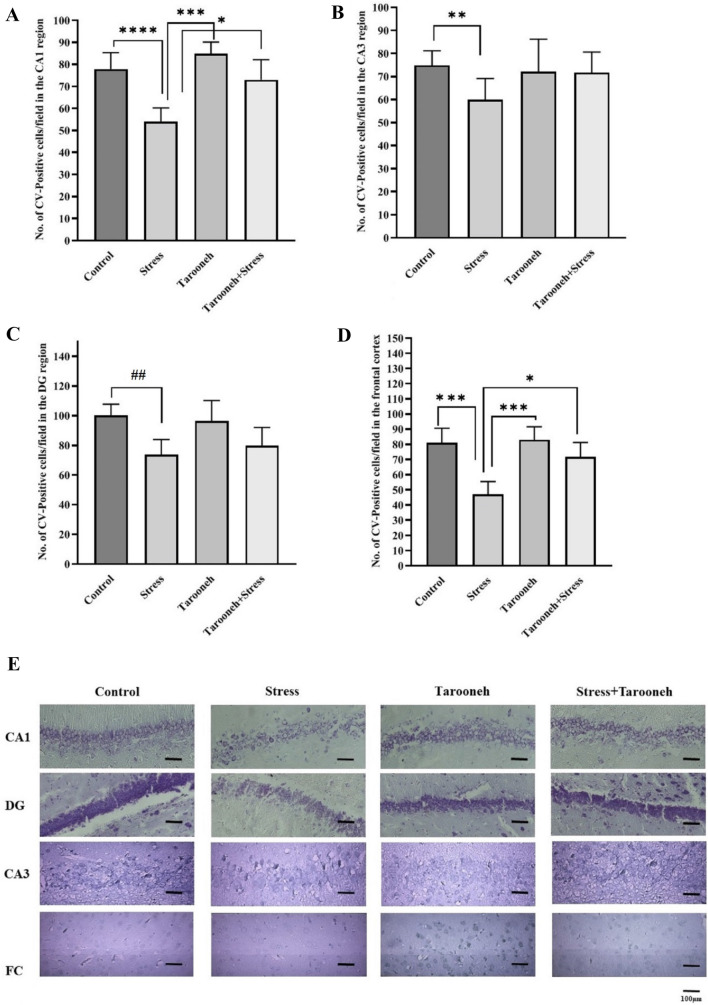
Fig. 7.
Quantitative analysis of neuronal damage in the different groups in the A CA1, B CA3, C DG, and D frontal cortex regions. All data are presented as mean ± SEM. *P < 0.05, **P = 0.0065, *** as P < 0.0001, **** as P = 0.0003, ##P = 0.0067. E CV staining of the CA1, CA3, DG and FC (frontal cortex) regions in the different groups. Three animals in each groups were used for CV staining. Three animals in each groups were used for CV staining. We counted ten microscopic fields at least in eight slides of each group, and the number of CV-positive cells was reported as mean ± SEM. The scale bars indicate 100 μm

