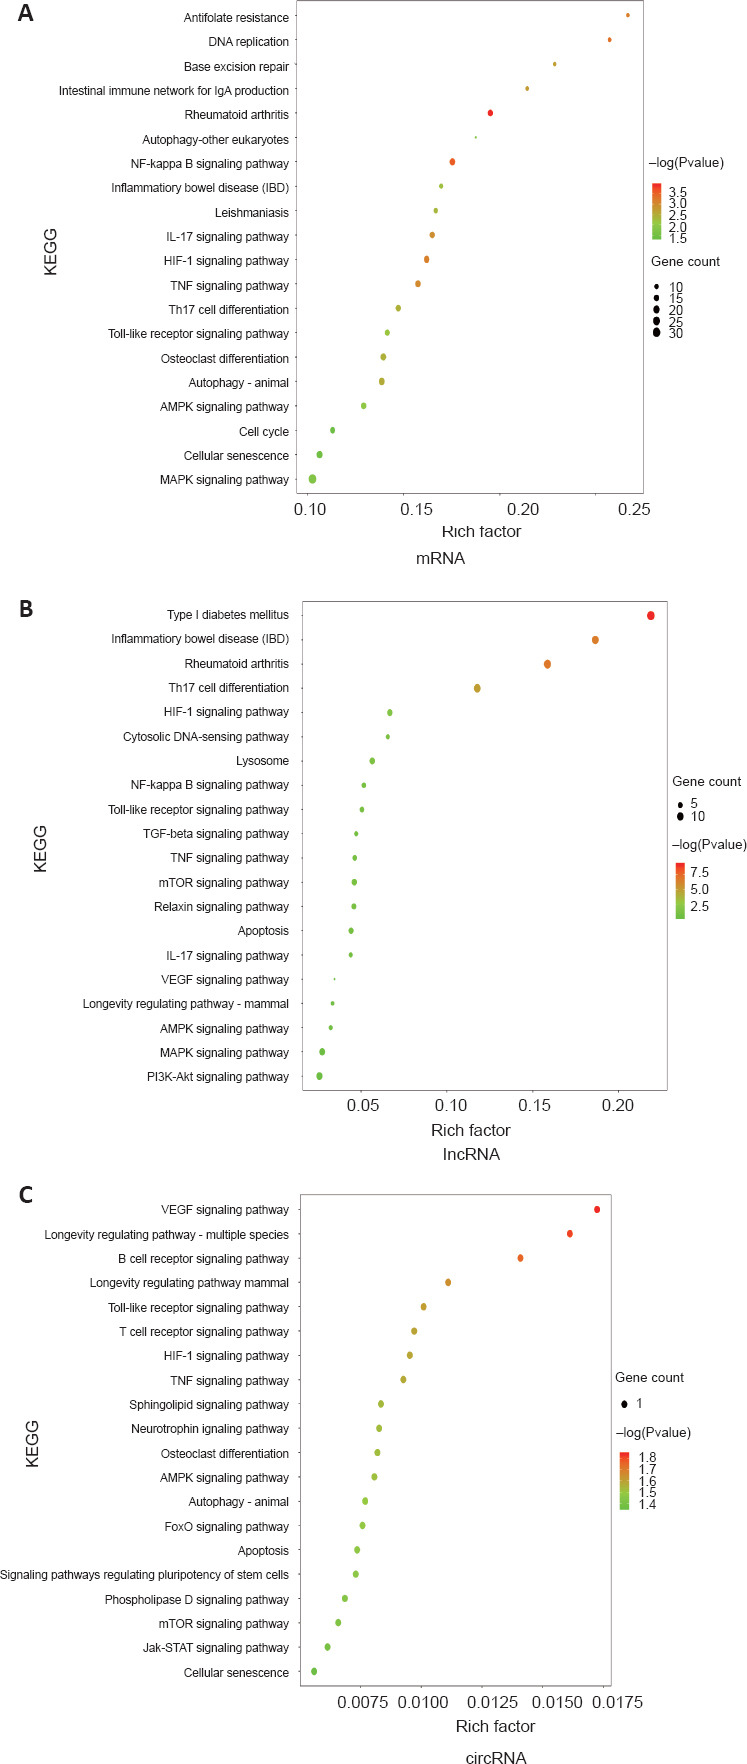
Figure 4.

KEGG pathway enrichment analysis of differentially expressed genes between M0 vs. M1 and M1 vs. M1 + PBM groups.
(A–C) KEGG pathway enrichment analysis of differentially expressed genes in mRNA (A), lncRNA (B) and circRNA (C), which suggested important roles of inflammation-related pathways. The size of the circle represents the number of genes. Darker red indicates a higher P-value. circRNA: Circular RNA; KEGG: Kyoto Encyclopedia of Genes and Genomes; lncRNA: long noncoding RNA; PBM: photobiomodulation.
