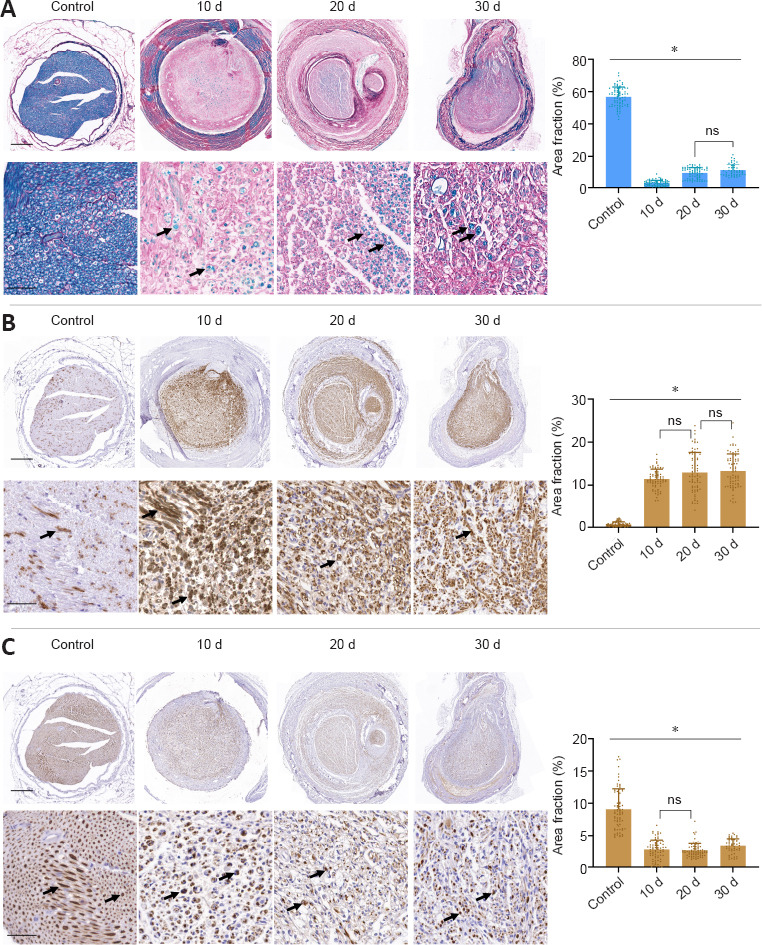
Figure 2.

Time-course microscopic and quantitative results of peripheral nerve regeneration through the conduit.
Figures show MCOLL (A), GAP-43 (B) and NFL (C) cross-section staining at low and medium magnifications from the central portion of repaired nerves by the collagen conduit. In addition, a representative transversal histological section of a healthy nerve (control) was included. Positive reaction areas are indicated with arrows. Quantitative results were included as positive area fraction for each histological technique (data are expressed as the mean ± SD). Stainings were performed at least three times and in three samples (animals) at each time point as described in the Methods section. Statistically differences (P < 0.05) were found in all comparison “*” unless indicated above by “ns”. Scale bars: 200 μm and 50 μm in images with higher magnification. GAP-43: Growth-associated protein-43; MCOLL: myelin-collagen histochemical method; NFL: neurofilament.
