
Figure 12.
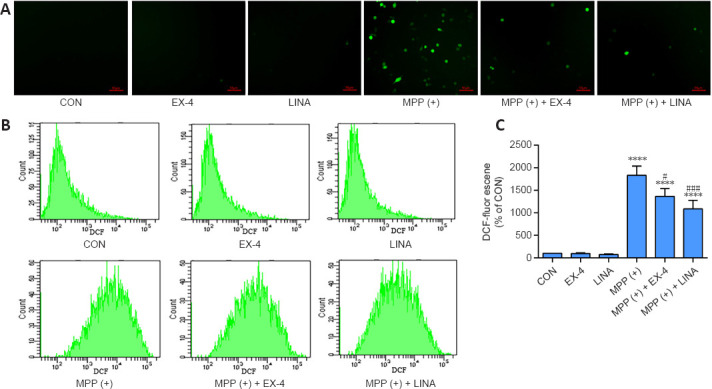
Effects of exendin-4 and linagliptin on MPP (+)-induced ROS production in BV2 cells.
(A) Fluorescence microscopy image of ROS (green) production in BV2 cells. The intensity of the ROS signal was increased in the MPP (+) group and decreased in the MPP (+) + EX-4 and MPP (+) + LINA groups. Scale bar: 50 µm. (B) ROS production in BV2 cells was measured using flow cytometry. (C) Quantitative analysis of ROS level (fluorescence intensity of DCF) in BV2 cells. Data are shown as mean ± SD. The experiment was repeated three times. ****P < 0.0001, vs. CON; #P < 0.05, ###P < 0.001, vs. MPP (+) (one-way analysis of variance followed by Tukey’s post hoc test). CON: Control; DCF: 2,7-dichlorofluorescein; EX-4: exendin-4; LINA: linagliptin; MPP (+): 1-methyl-4-phenylpyridium; ROS: reactive oxygen species.