Figure 1.
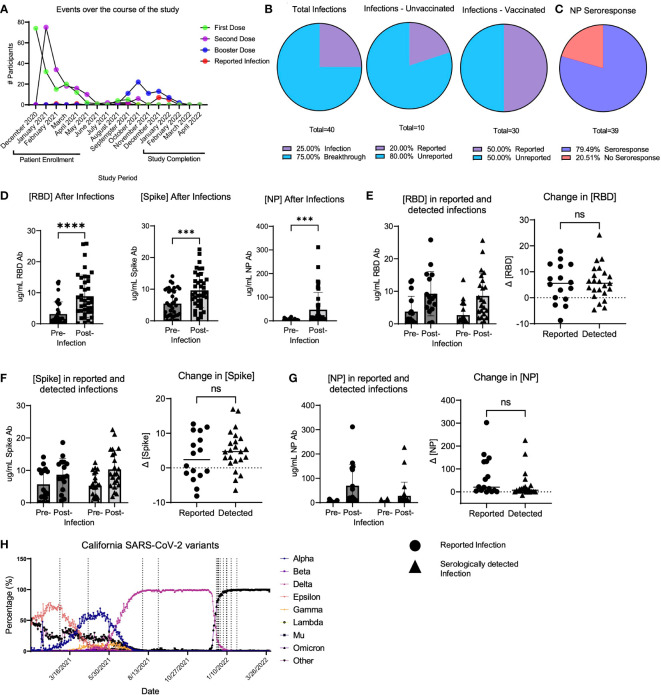
LA-SPARTA infections during the study period. (A) shows the events that occurred for all LA-SPARTA participants over the course of the study period. (B) describes both the reported and serologically detected infections in unvaccinated participants and breakthrough infections in vaccinated participants. (C) shows the percentage of infections and breakthrough infections in which the NP concentration increases by ≥4-fold compared to the previous blood sample collected. (D) shows the concentration of RBD, Spike, and NP in all serologically detected and reported infections and breakthrough infections. (E) shows the concentration of RBD in infections and breakthrough infections, separated by serologically detected versus reported infections. The delta change between the pre-infection sample collected and post-infection samples is also shown. (F) shows the concentration of Spike in infections and breakthrough infections, separated by serologically detected versus reported infections. The delta change between the pre-infection sample collected and post-infection samples is also shown. (G) shows the concentration of NP in infections and breakthrough infections, separated by serologically detected versus reported infections. The delta change between the pre-infection sample collected and post-infection samples is also shown. (H) uses SARS-CoV-2 variant data available from the California department of Health and Human Services from Los Angeles County to illustrate the percentage of each variant circulating at the time of reported positive tests (vertical dashed lines) in the LA-SPARTA cohort. *** designates P >0.001 and **** designates P >0.0001. ns, not significant.

