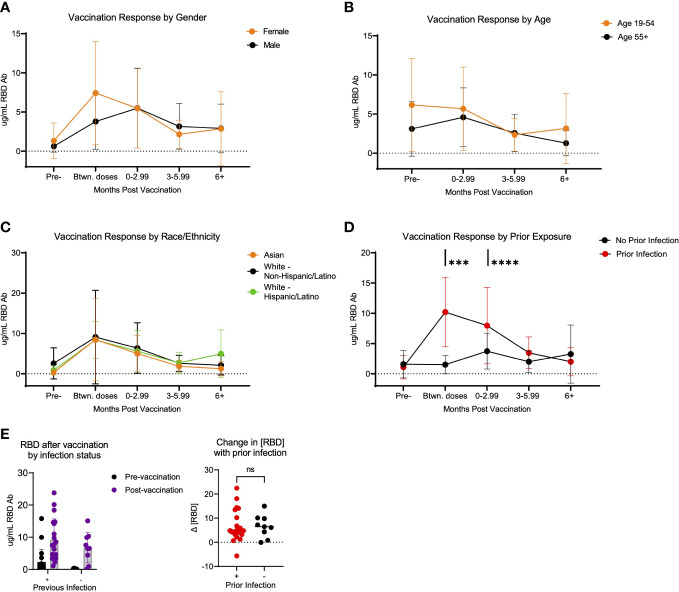
Figure 3.
Response to SARS-CoV-2 vaccination in LA-SPARTA participants differs with prior infection. (A) shows the concentration of RBD over time according to age. Participants over 55 years of age were compared to all participants below 55 years of age. (B) shows the concentration of RBD over time according to gender. (C) shows the concentration of RBD over time according to race/ethnicity. (D) shows the concentration of RBD over time according to prior infection status before vaccination. (E) shows only the difference in RBD concentration in participants who were vaccinated over the course of the study, using the first available sample after vaccination (regardless of timing after vaccination) according to whether they had a prior infection at enrollment and prior to vaccination. The change in RBD concentration is also shown between the pre-infection and post-infection blood samples. *** designates P >0.001 and **** designates P >0.0001. ns, not significant.

