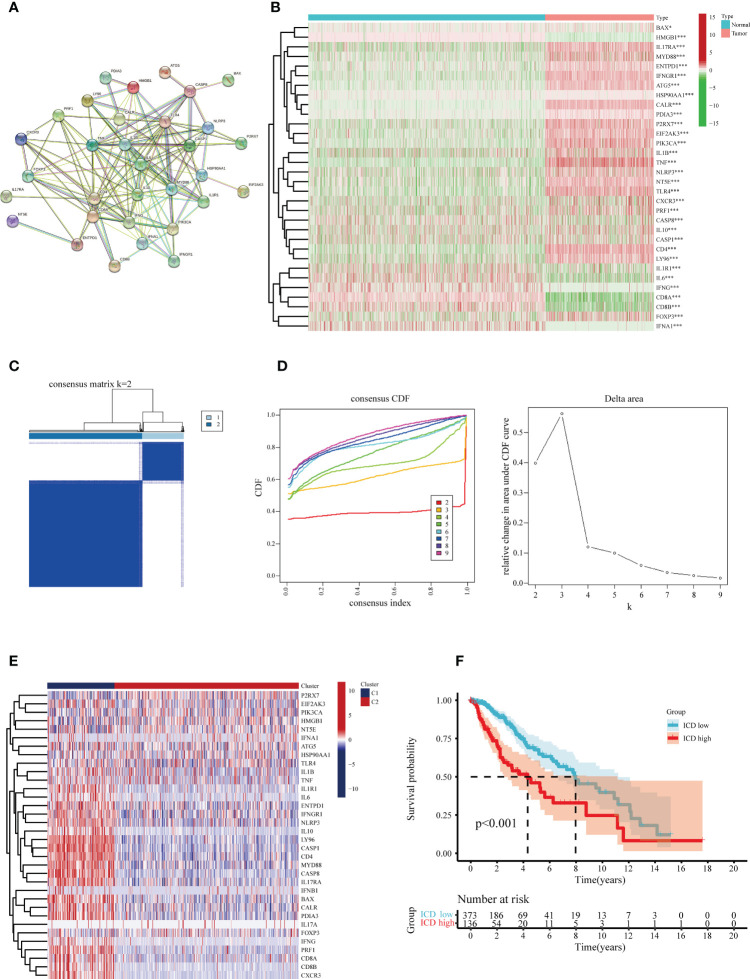
Figure 2.
Identification of the differentially expressed ICD-related genes and sub-clusters derived from these genes. (A) Protein-protein interactions (PPI) among the differentially expressed ICD-related genes. (B) Heatmap visualization of expression levels in 32 differentially expressed ICD-associated genes between lower-grade glioma (LGG) samples and normal brain tissue specimens, respectively, from the TCGA and GTEx databases. (C) In accordance with the consensus clustering matrix (k =2), LGG patients were split into two sub-clusters. (D) Consensus clustering cumulative distribution function (CDF) with k=2-10. (E) Heatmap depicts the expression levels of 34 ICD- associated genes between various subclasses. The blue color denotes low expression, and the red means high expression. (F) Kaplan-Meier (KM) curves for patients’ overall survival (OS) between the two clusters. *P < 0.05; ***P < 0.001.

