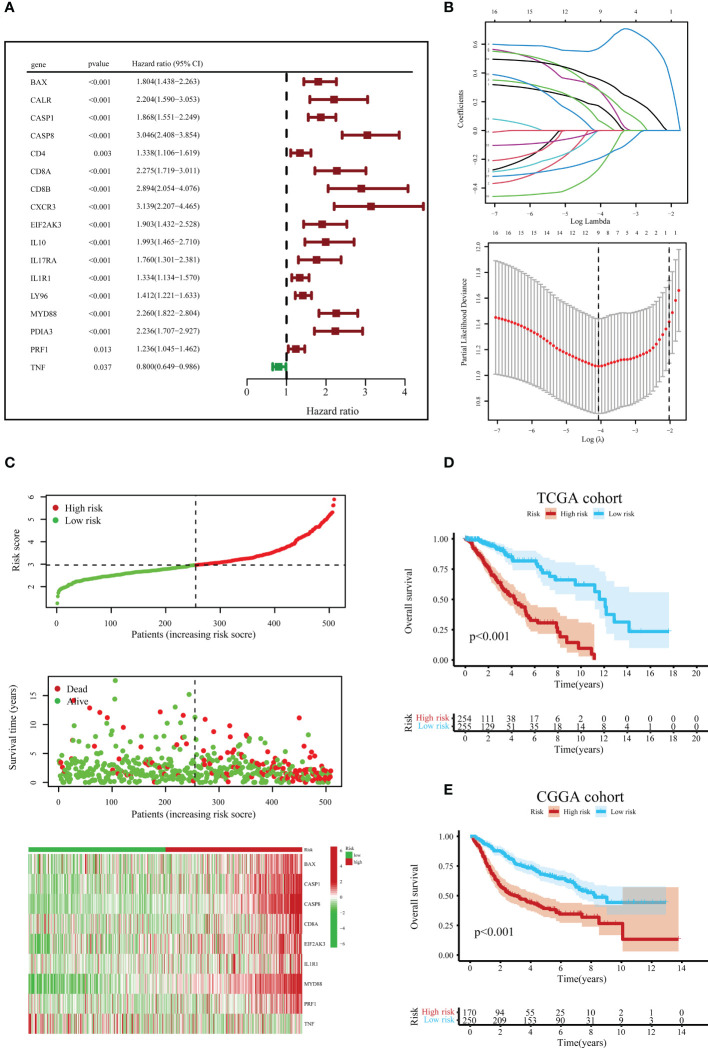
Figure 6.
Construction and verification of the ICD risk signature. (A) Univariate Cox regression models identified 17 ICD-related genes associated with overall survival (OS). (B) Through LASSO Cox regression analysis, nine prognostic ICD-related genes were identified in the TCGA queue. (C) Distribution map of the risk score, individual case survival information, and a clustering heatmap of mRNA expression profiles of the nine signature genes in the TCGA cohort. (D) Kaplan-Meier (KM) curves for the OS of LGG patients in the low- and high-risk subclasses in the TCGA queue. (E) Likewise, the KM curves for OS in the CGGA queue.

