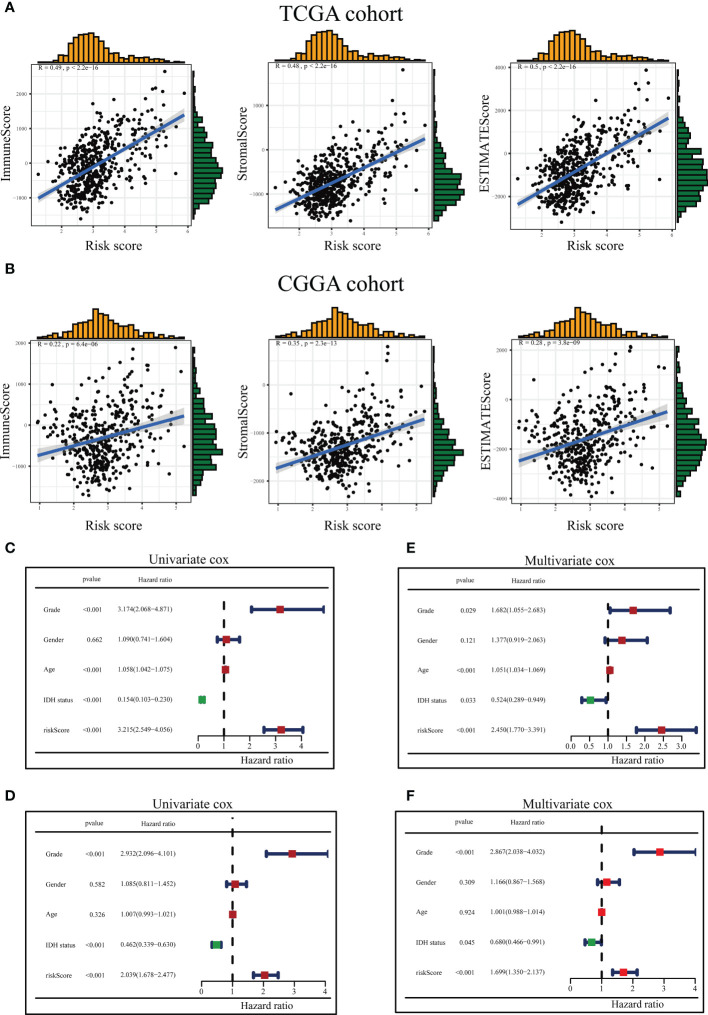
Figure 7.
Association between the tumor microenvironment and ICD risk signature and evaluation of risk scores and predictive power of clinical variables. The relationship between the risk score and immune score, stromal score as well as ESTIMATE score in the TCGA queue (A) and the CGGA queue (B). Forest diagram of Univariate analysis of the risk signature scores combined with well-known clinical risk variables for the TCGA-LGG queue (C) and the CGGA-LGG queue (D). Forest diagram of Multivariate analysis of the risk signature scores combined with well-known clinical risk variables for the TCGA-LGG queue (E) and the CGGA-LGG queue (F).

