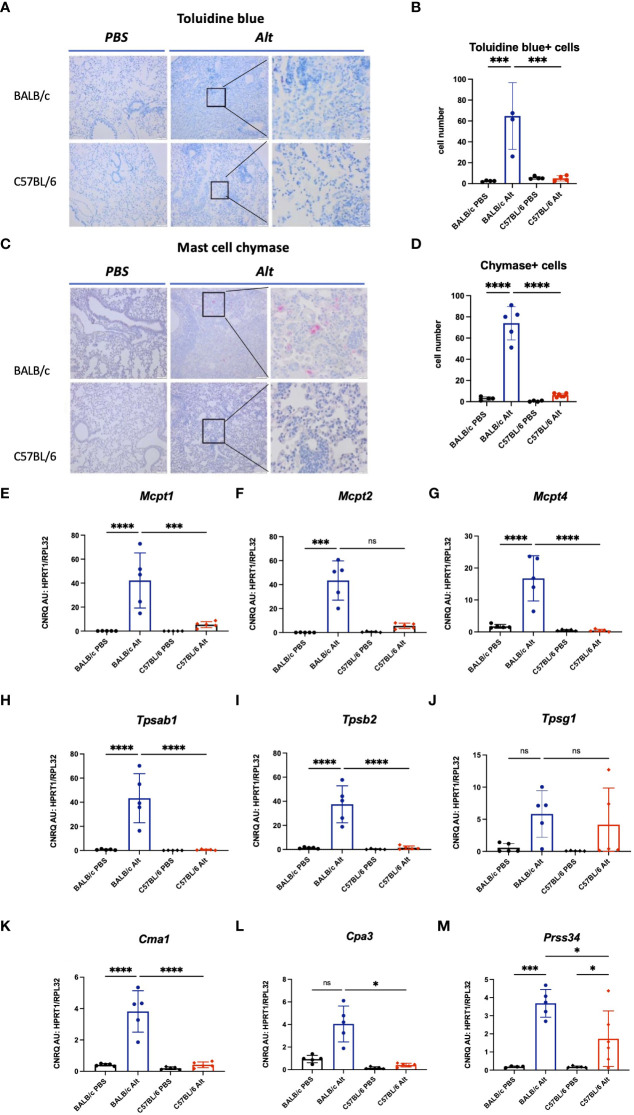
Figure 3.
To visualize mast cells, formalin-fixed paraffin-embedded lung sections were stained with toluidine blue (A) and the number of mast cells was quantified in four different fields per mouse under magnification of forty times (B). Chymase - positive mast cells in the lungs of mice were visualized by immunohistochemistry (C) and quantified (D). Expression of mast cell proteases in the lungs of BALB/c and C57BL/6 mice treated with six intratracheal applications of 20 µg Alt extract or PBS. Values of gene expression of Mcpt1 (E), Mcpt2 (F), Mcpt4 (G), Tpsab1 (H), Tpsab2 (I), Tpsg1 (J), Cma1 (K), Cpa3 (L) and Prss34 (M) were normalised using reference genes Hprt1 and Rpl32. The data are presented as scatter plot with a bar ± standard deviation (S.D.). Statistical significance between the groups was determined by one-way ANOVA with Sidak’s test for multiple comparisons. n=4-6 per group. *p < 0.05, ***p < 0.001, ****p < 0.0001. ns, not significant.

