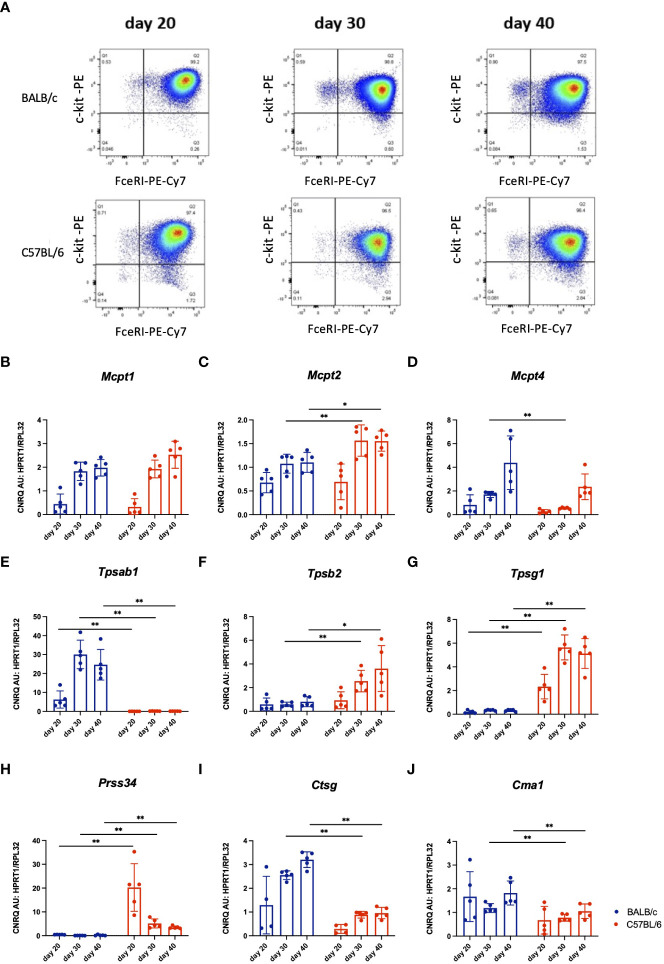
Figure 4.
Representative dot plots of in vitro differentiated BMMCs from BALB/c and C57BL/6 mice cultured in vitro for 20, 30 or 40 days, respectively. Viable mast cells were analyzed for their expression of FceRI and c-kit using flow cytometry (A). Next, gene expression analysis by RT-qPCR of mast cell proteases in these cultured BMMCs from I BALB/c and C57BL/6 mice was performed. Values of gene expression of Mcpt1 (B), Mcpt2 (C), Mcpt4 (D), TpI1 (E), Tpsb2 (F), Tpsg1 (G), Prss34 (H), Ctsg (I) and Cma1 (J) were normalised to reference genes Hprt1 and Rpl32. The data represent individual values, bars ± standard deviation (S.D.). Statistical significance between the groups was determined by Mann-Whitney test comparing BALB/c and C57BL/6 mice at each individual time point. The BMMCs were collected from two separate experiments, n=5 per group. *p < 0.05, **p < 0.01.

