Figure 1.

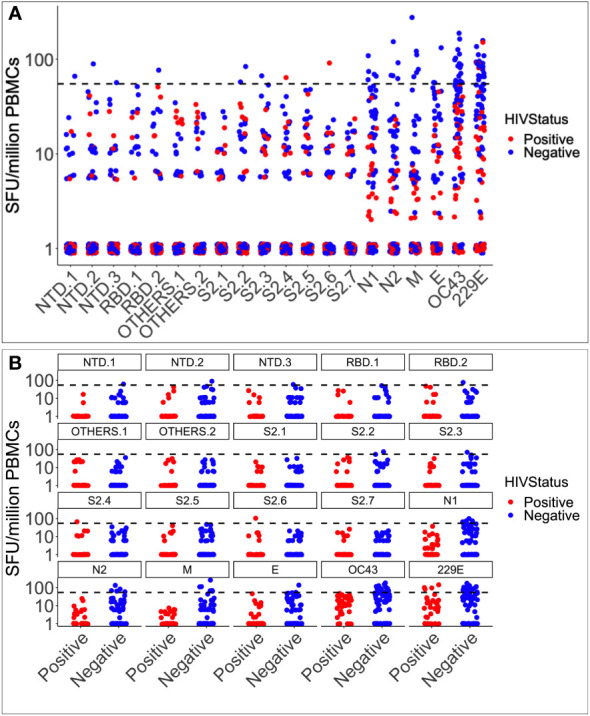
Pre-epidemic IFN-γ responses to SAR-CoV-2, HCoV-229E and HCoV-OC43. Illustrates the virus-specific IFN-γ responses to 18 SARS-CoV-2 and two human coronavirus peptide pools (HuCoVOC43 and HuCoV229E). IFN-γ response magnitudes are depicted and quantified as spot-forming units per million PBMC cells. The horizontal dotted red line represents the cut-off threshold for a positive response of 55 SFU/million PBMCs (A). The data represents 104 pre-COVID specimens classified as positive in red and negative in blue based on HIV serostatus (B).
