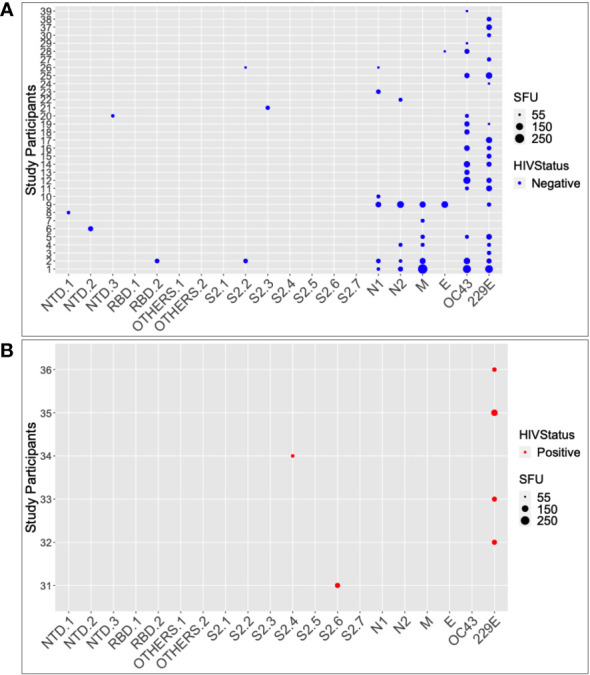
Figure 2.

The SARS-CoV-2 and HuCoV peptide pools targeted by HIV-1 status. Summarizes the individual responses to each peptide pool for 39 of the participants who responded positively to at least one peptide pool. The data is stratified by HIV serostatus, with HIV negatives in blue (A) and HIV positives in red (B). The larger the size of the circle, the greater the response.
