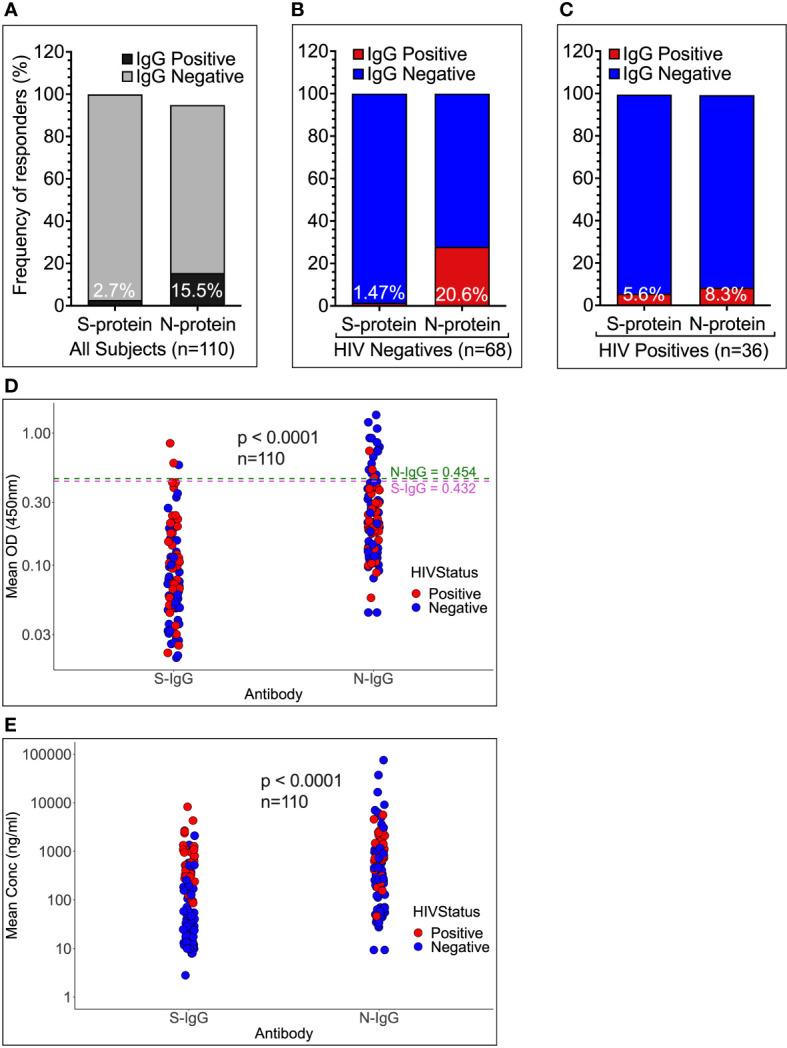
Figure 4.

Frequencies and magnitudes of SARS-CoV-2 -specific cross-reactive IgG binding antibodies by HIV status. The frequency of pre-epidemic cross-reactive anti-SARS-CoV-2 binding IgG antibodies in Ugandan pre-pandemic sera is depicted in Figure 4 . 110 specimens (A) were stratified by HIV-1 negative (B) and positive serostatus (C), and the proportions of subjects with cross-reactive IgG binding antibodies against the SARS-CoV-2 spike and nucleoprotein illustrated. (D, E) summarises the medians of means of duplicate IgG antibody OD values in nm and concentration levels in ng/ml, respectively. The cut-off OD values are shown by the dashed lines.
