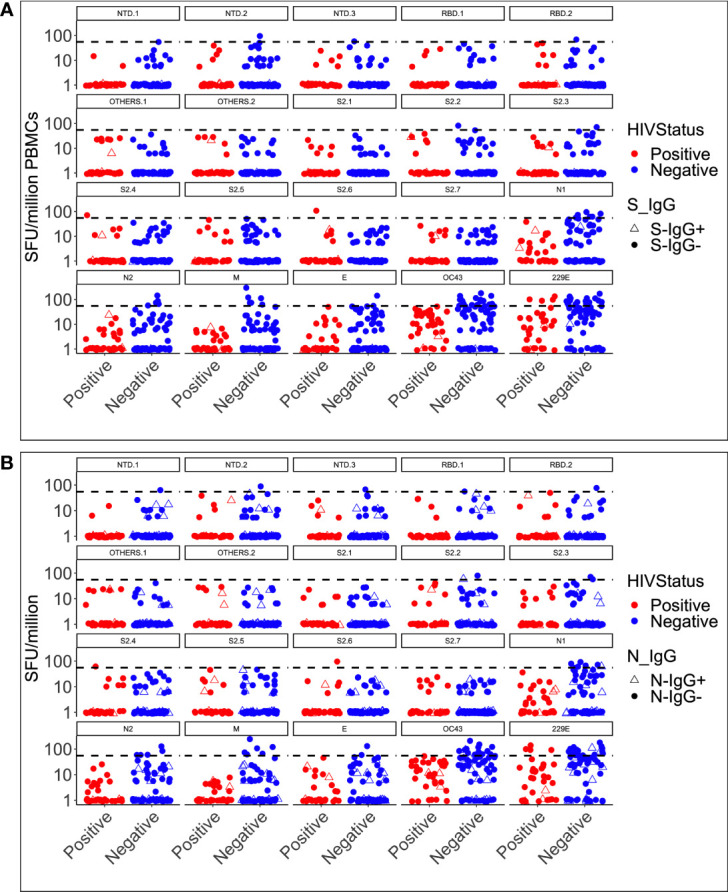
Figure 5.

IFN-γ cross-reactivity categorised HIV status and spike (A) and nucleoprotein (B) IgG response. Depicts the simultaneous induction of SARS-CoV-2-specific IgG antibodies and IFN-γ cross-reactive responses in 104 specimens with antibody and T-cell data against the spike (A) and the nucleoprotein (B). The data is presented according to HIV serostatus, with HIV-positive individuals in red and HIV-negative individuals in blue. Open triangles represent participants with cross-reactive antibodies and IFN-γ responses.
