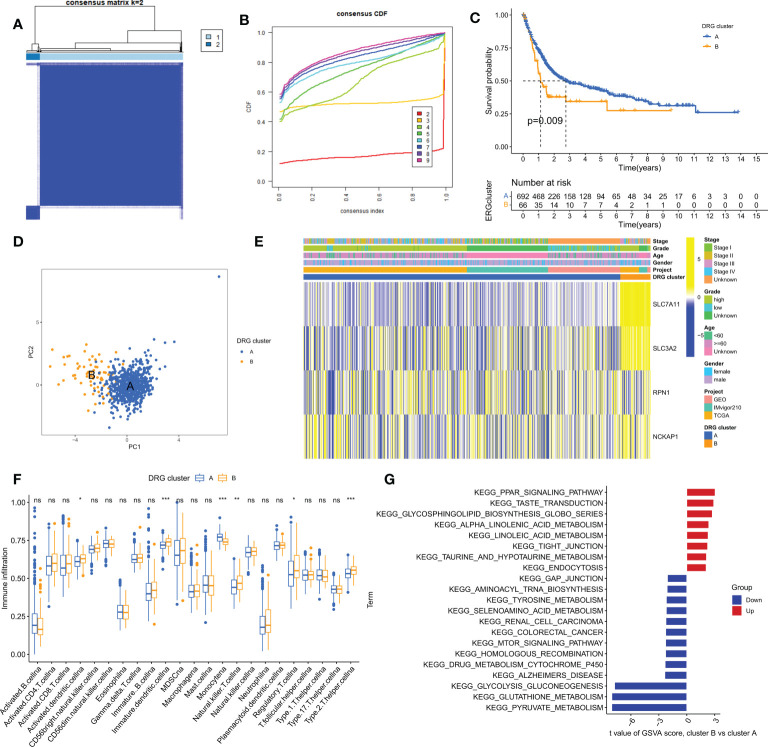
Figure 3.
Clinical, pathological, and biological characteristics of two DRG clusters. (A) All samples from the TCGA-BLCA, iMvigor210, and GSE13507 cohorts were divided into two clusters using a consensus clustering algorithm (k=2). (B) Cumulative Distribution Function (CDF) from k=2 to 9. (C) Kaplan-Meier curve shows different overall survival (OS) between the two DRG clusters. (D) Principal Component Analysis (PCA) shows significant differences between the two DRG clusters. (E) Heatmap shows differences in clinical information and DRG expression between the two DRG clusters. (F) Abundance of 23 infiltrating immune cells in the two DRG clusters. (G) GSVA of biological pathways between the two DRG clusters. ns, no significance,*p< 0.05, **p< 0.01, ***p< 0.001.

