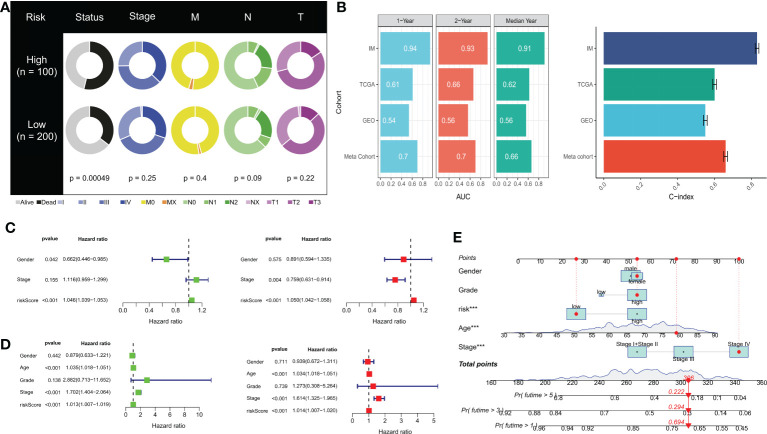
Figure 6.
Prognostic value of risk scores and clinical characteristics of BLCA patients. (A) Pie chart showing the survival status and clinical stage of patients in high and low-risk groups. (B) AUC values for 1-year, 2-year, and median survival time in TCGA-BLCA, iMvigor210, GSE13507, and meta cohorts. Concordance index (C-index) for TCGA-BLCA, iMvigor210, GSE13507, and meta cohorts. (C) Univariate and (D) multivariate Cox analysis evaluating prognostic and clinical features, including age, grade, and stage. (E) Nomogram of risk score and clinical characteristics for predicting 1-, 3-, and 5-year survival rates in the TCGA cohort. ***P< 0.001.

