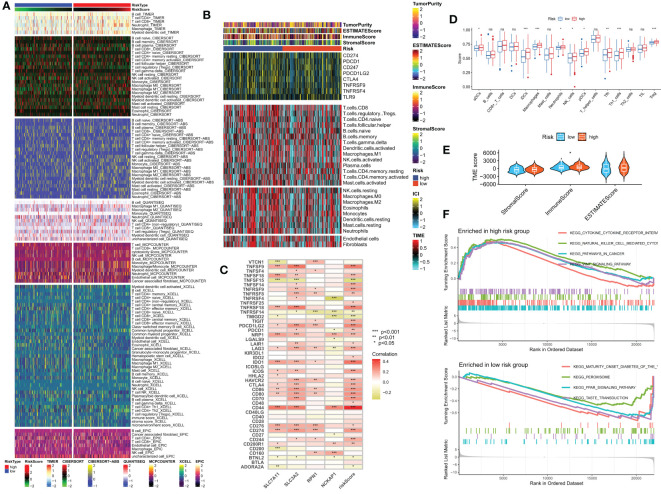
Figure 8.
Analysis of the immune microenvironment in different risk groups. (A) Differences in immune infiltration status between different risk groups were evaluated by seven algorithms. (B) Heatmap showing differences in TME score, immune checkpoint expression, and immune cell infiltration calculated by Cibersort among different risk subgroups. (C) Correlation between the expression of all immune checkpoints and DRG and risk scores. (D) Differences in immune cell infiltration between different risk groups. (E) Differences in TME scores between different risk groups. (F) GSEA analysis of different KEGG pathways focused on high and low-risk groups. ns, no significance, *p< 0.05, **p< 0.01, ***p< 0.001.

