Figure 9.
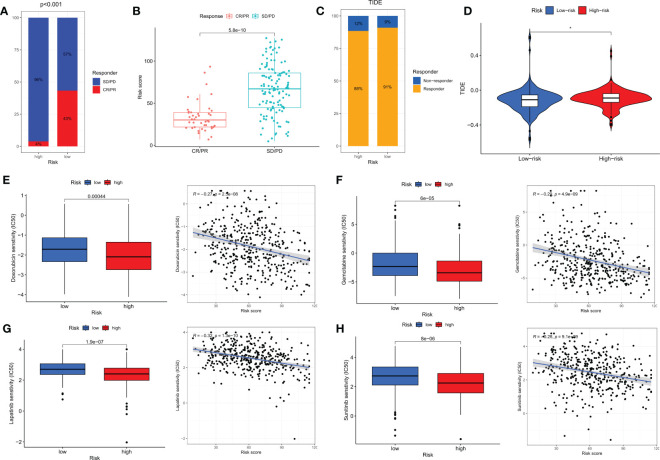
Immunotherapy and chemotherapy in different risk groups. (A) Proportions of response to anti-PD-L1 immunotherapy in high- and low-risk groups. (B) Differences in risk scores between different response groups in the IMvigor210 cohort. (C) Proportions of response to immunotherapy in high- and low-risk groups based on TIDE results. (D) Differences in TIDE scores between high- and low-risk groups. (E–H) Differences in chemotherapy sensitivity of Doxorubicin, Gemcitabine, Lapatinib, and Sunitinib among different risk groups. CR, complete response; PR, partial response; SD, stable disease; PD, progressive disease. *p<0.05.

