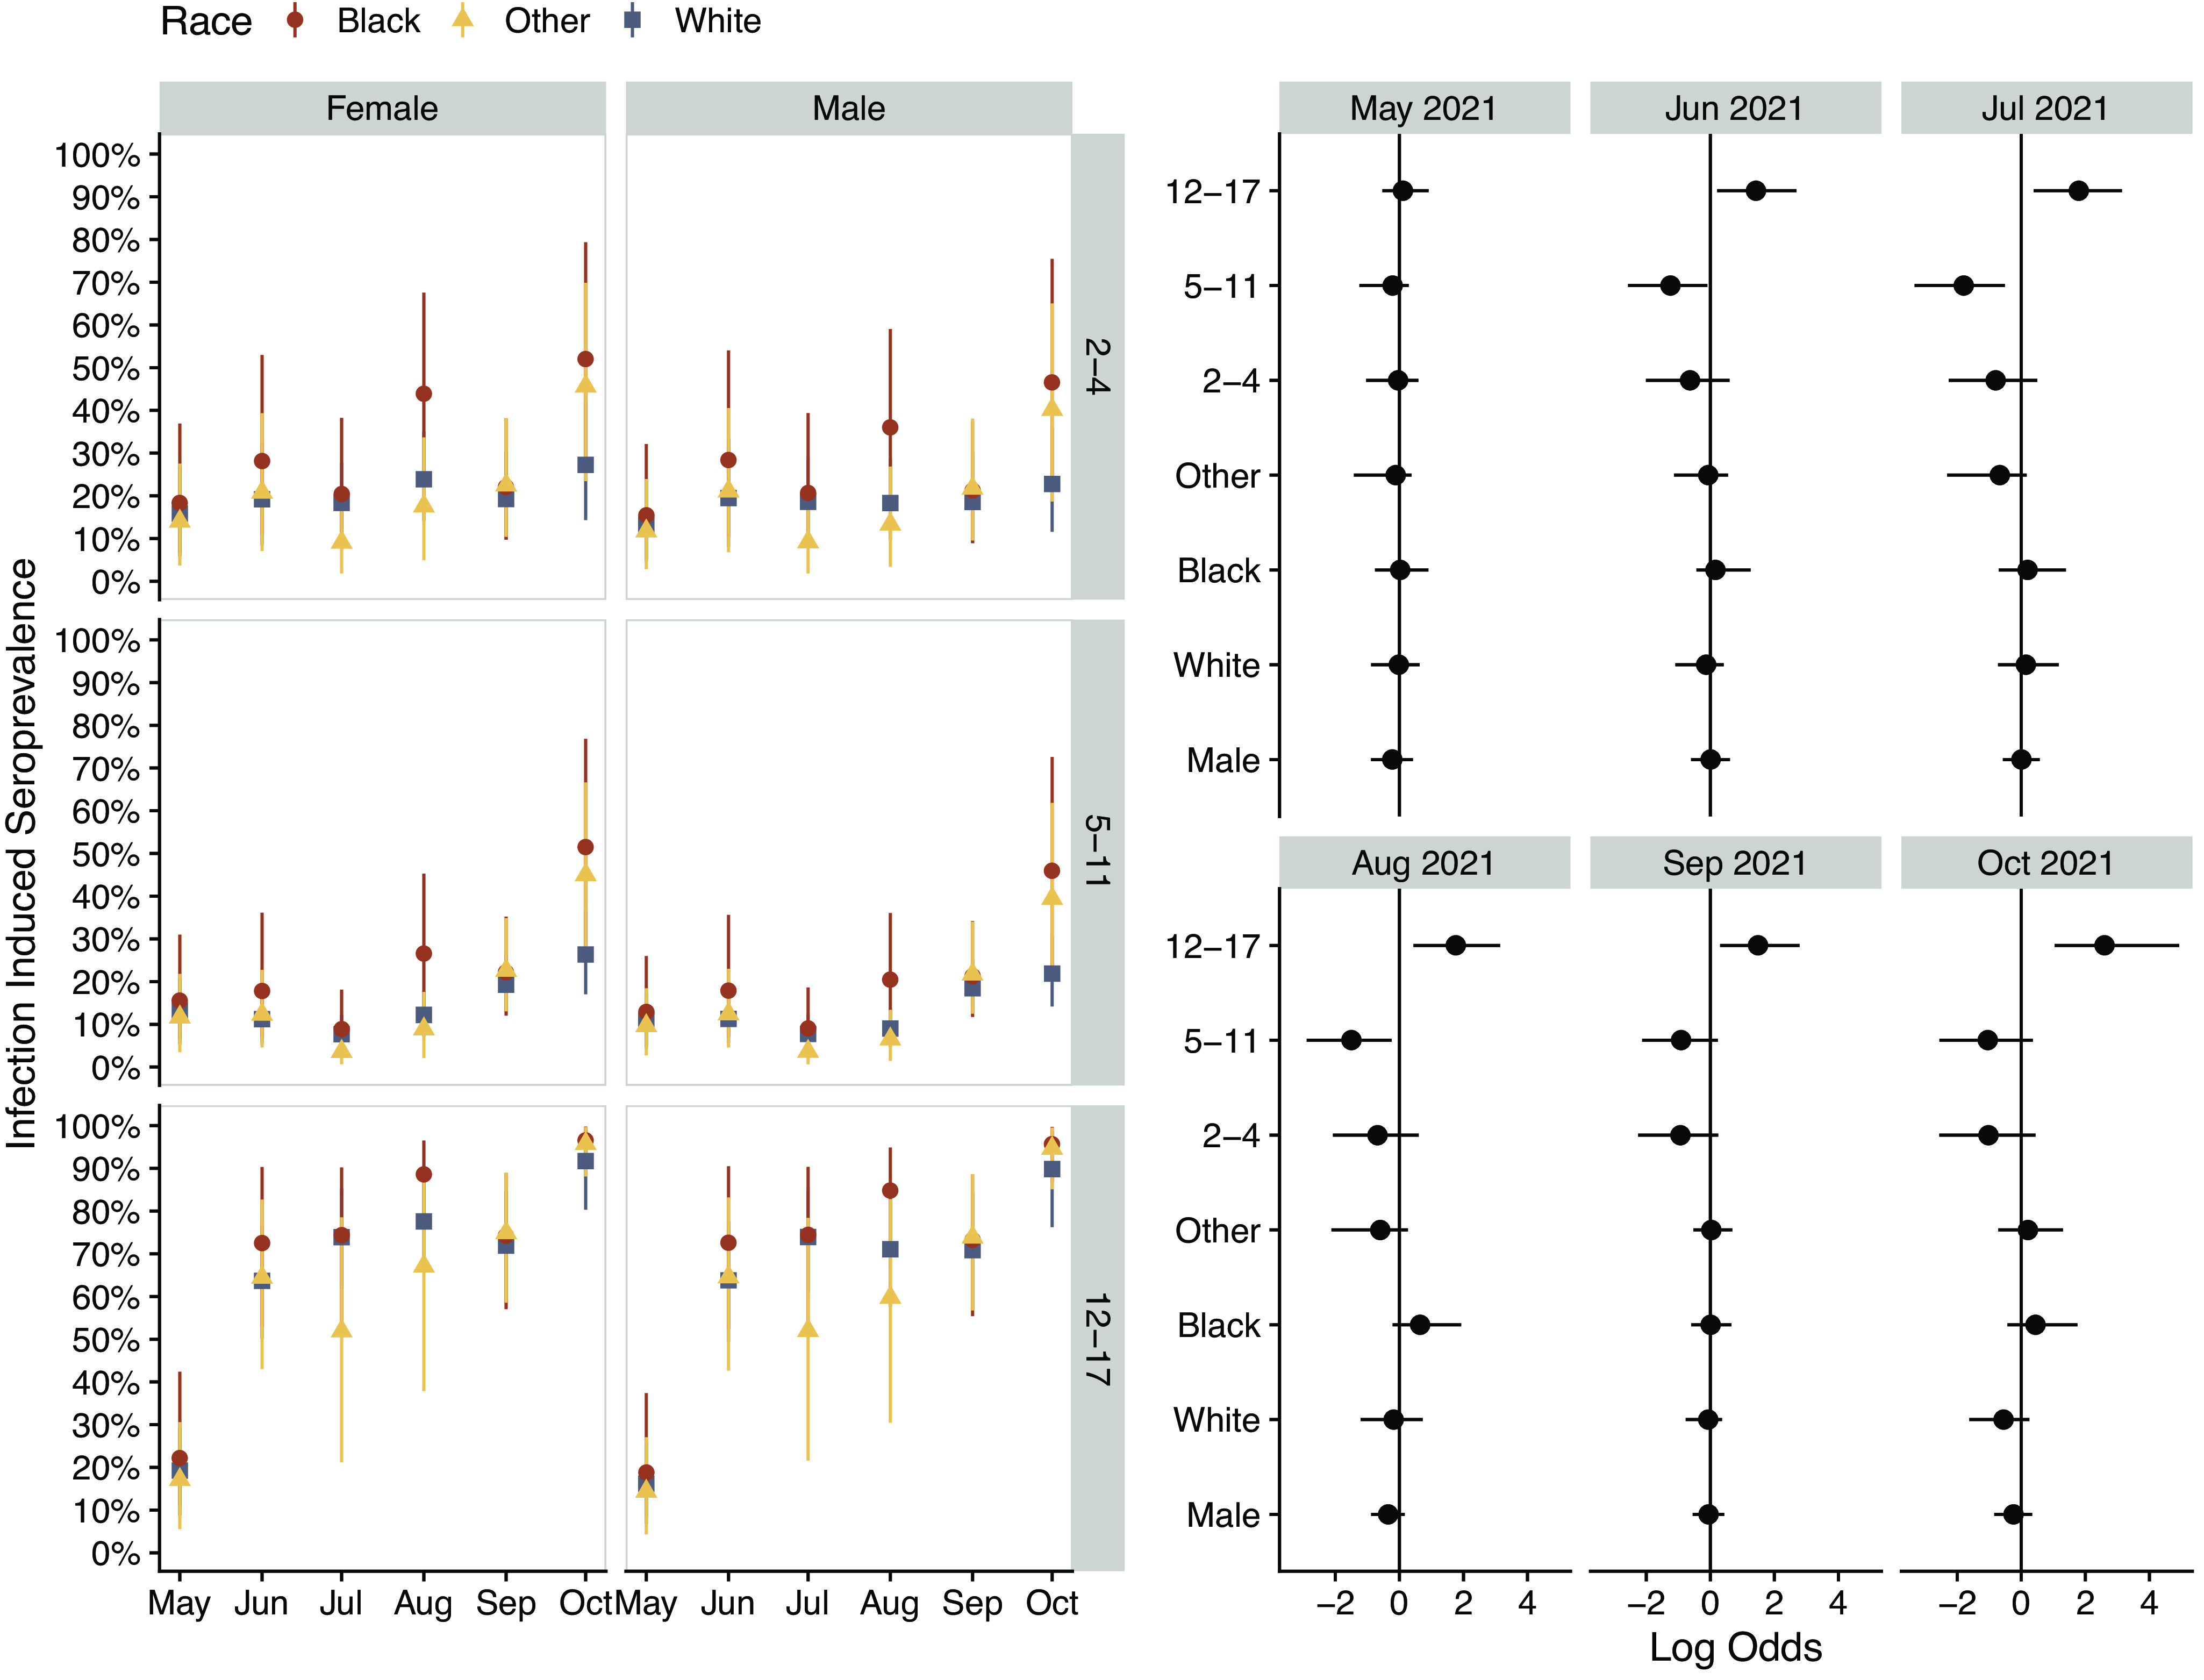
Figure 3.

Modelled prevalence of infection-induced SARS-CoV-2 antibodies by age for North Carolina by demographic in 2021 (a). Simultaneous estimated model parameters (posterior log odds) for likelihood of seropositivity by month of data collection (b). Group level (random) effects are shown for race and age while the population (fixed) effect is shown for sex. All model estimates consider assay sensitivity and specificity and reflect 95% credible intervals.
