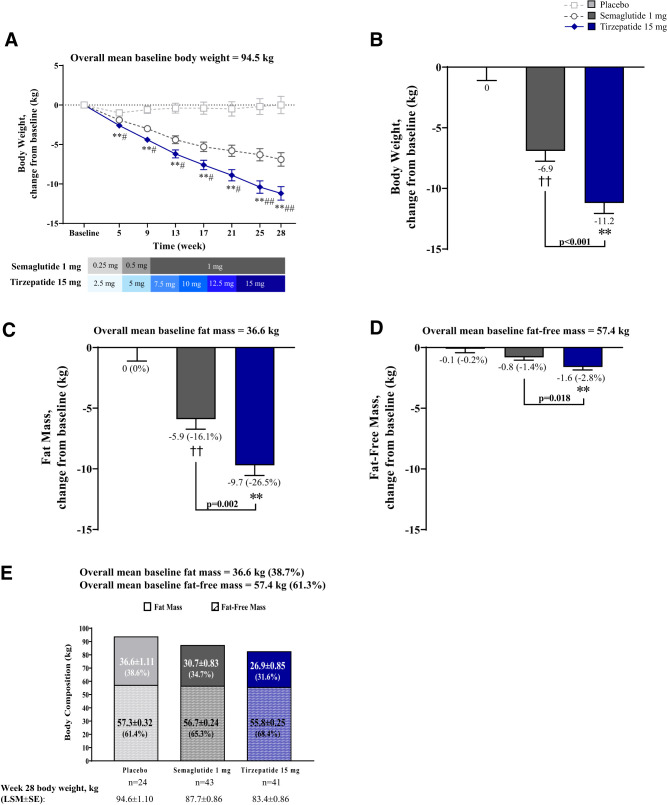
Figure 1.
Change from baseline in body weight and body composition and effect on fat mass reduction on body composition. Data are LSM ± SE of ANCOVA or MMRM on postbaseline or change from baseline values from the pharmacodynamic analysis set. (A) Change from baseline in body weight over time. (B) Change from baseline in body weight at 28 weeks. (C) Change from baseline in fat mass at 28 weeks (percent changes from baseline are in parentheses). (D) Change from baseline in fat-free mass at 28 weeks (percent changes from baseline are in parentheses). (E) Effect of fat mass on body composition (percent of fat or fat-free mass in body mass at 28 weeks are in parentheses). **P < 0.001 versus placebo, ##P < 0.05 and P < 0.001 tirzepatide versus semaglutide 1 mg for MMRM on change from baseline (A and B) and for ANCOVA on change from baseline (C and D). LSM, least squares mean; MMRM, mixed model repeated measures.

