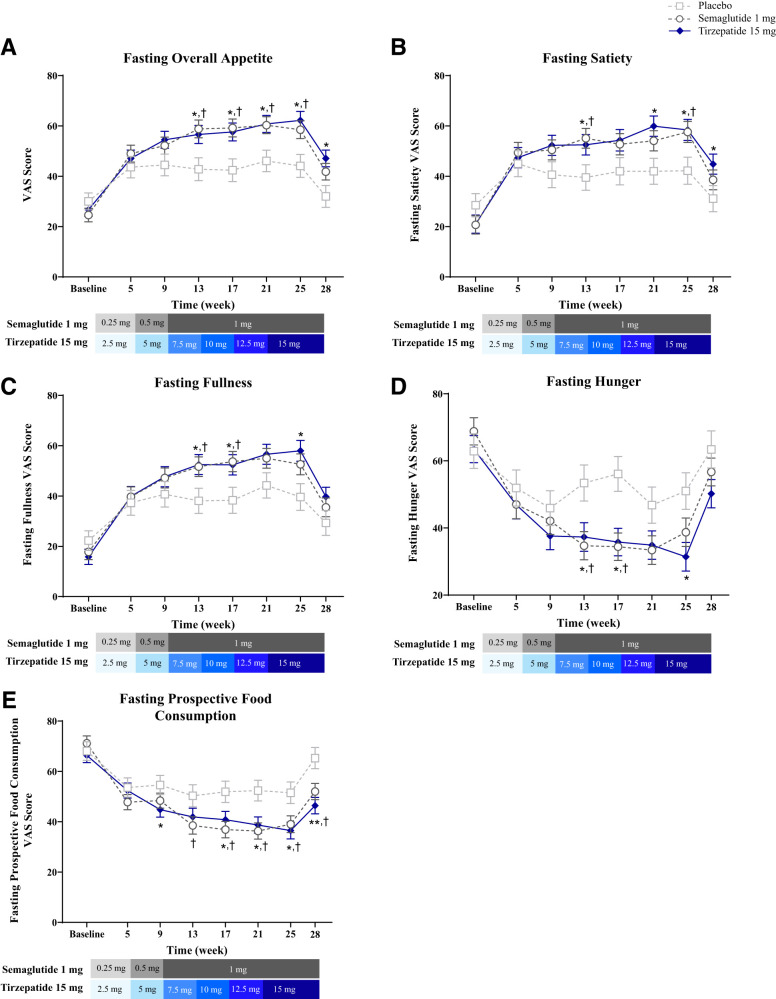
Figure 2.
Fasting overall VAS score and individual components over time. Data are LSM ± SE of ANOVA on baseline (actual values) and MMRM postbaseline values over time from the pharmacodynamic analysis set. (A) Fasting overall appetite score over time. Note: A higher overall score indicated less appetite. (B) Fasting satiety score over time. Note: A higher overall score indicated less satiety. (C) Fasting fullness score over time. Note: A higher overall score indicated less fullness. (D) Fasting hunger score over time. (E) Fasting prospective food consumption score over time. *P < 0.05 and **P < 0.001 tirzepatide versus placebo; †P < 0.05 semaglutide versus placebo. LSM, least squares mean; MMRM, mixed-model repeated measures.

