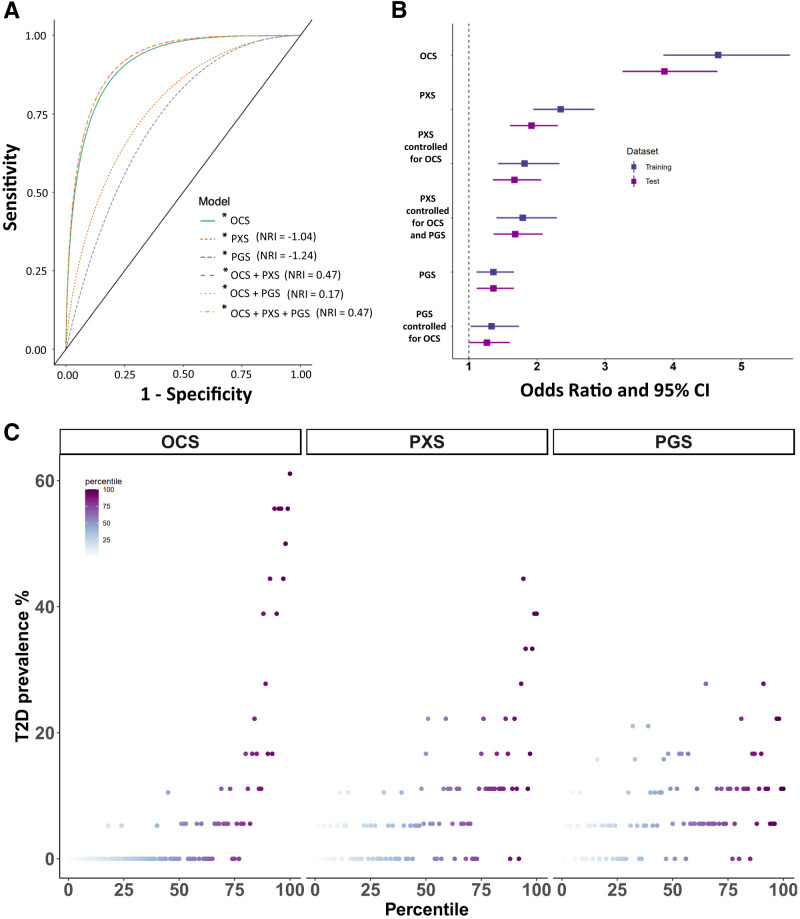
Figure 3.
A: Sensitivity and specificity of OCS, PXS, PGS, and their combinations for association with type 2 diabetes odds. A higher AUC indicates better predictive accuracy. A positive NRI indicates improved reclassification. B: ORs and their 95% CIs for OCS, PXS, PGS, and their combinations for association with type 2 diabetes odds. For the combined risk score models, the displayed ORs are the values after controlling for other scores as noted. Dark blue denotes values from the training data set, and purple denotes values from the test data set. C: Predictive score percentile plots. Participants in the test data set were binned into 100 groups based on the percentile for each score separately. Type 2 diabetes (T2D) prevalence is plotted against the score percentile for each score.

