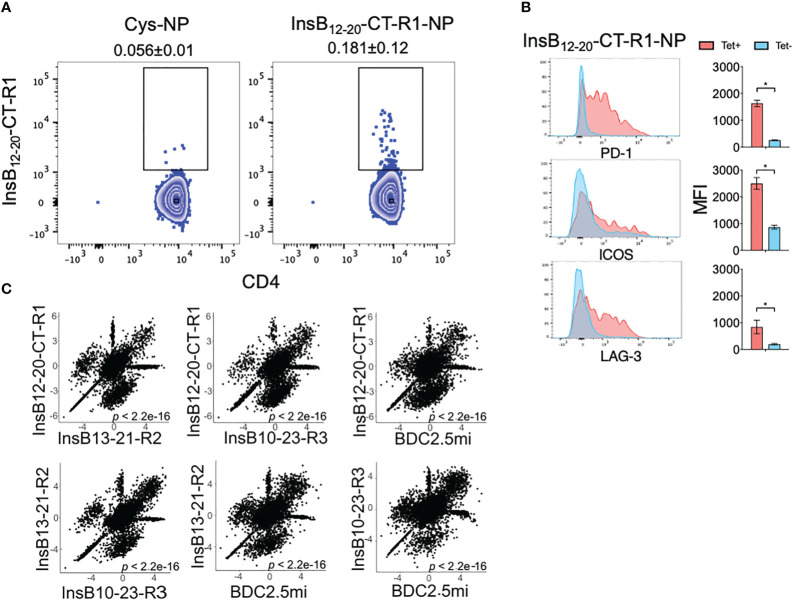
Figure 2.
pMHCII-NP-induced TR1-like cell formation in pre-diabetic NOD mice in vivo. (A) Cognate tetramer staining profiles of splenic CD4+ T cells from NOD mice treated with NPs coated with pMHCIIs displaying the InsB12-20-CT-R1 epitope. Left panel, Cys-NP (control)-treated mice; Right panel, pMHCII-NP-treated mice. The average ± SEM values shown on top of each plot correspond to the percentages of Tet+ cells within the CD4+B220– gate (n=6 and 3 mice/NP type, respectively). (B) Flow cytometry staining profiles and average ± SEM mean fluorescence intensity (MFI) staining values for PD-1, ICOS and LAG-3 on tetramer+ versus tetramer– splenocytes. *, P<0.05 (Mann-Whitney U test). (C) Correlation between the levels of gene expression among tetramer+ cells isolated from mice treated with InsB12-20-CT-R1/IAg7-NP, InsB13-21-R2/IAg7-NP, InsB10-23-CT-R3/IAg7-NP and BDC2.5mi/IAg7-NP as compared to tetramer– cells (Tconv control) purified from InsB12-20-CT-R1/IAg7-NP-treated mice. The P value refers to the Pearson correlation coefficient for each comparison.

