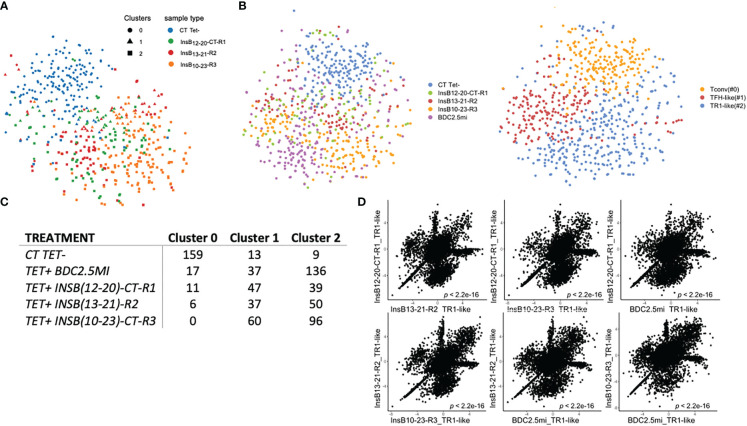
Figure 3.
Single cell (sc) RNAseq analysis of tetramer+ CD4+ T-cells from pMHCII-NP-treated mice. (A) t-SNE plot of scRNAseq data for tetramer+ cells isolated from mice treated with InsB12-20-CT-R1/IAg7-, InsB13-21-R2/IAg7- or InsB10-23-CT-R3/IAg7-NPs as compared to tetramer– cells (control) purified from InsB12-20-CT-R1/IAg7-NP-treated mice. (B) t-SNE plots of scRNAseq data for cells from the mice in (A) plus tetramer+ cells from NOD mice treated with BDC2.5mi/IAg7-NPs. Left, cluster types; Right, pMHCII specificities. (C) Table depicting the number of cells belonging to each cell cluster as a function of tetramer-binding specificity. (D) Correlation between the levels of gene expression among TR1-like (cluster #2) cells from mice treated with InsB12-20-CT-R1/IAg7-NP, InsB13-21-R2/IAg7-NP, InsB10-23-CT-R3/IAg7-NP and BDC2.5mi/IAg7-NPs as compared to tetramer– cells (Tconv control) purified from InsB12-20-CT-R1/IAg7-NP-treated mice. The P value refers to the Pearson correlation coefficient for each comparison.

