Figure 4.
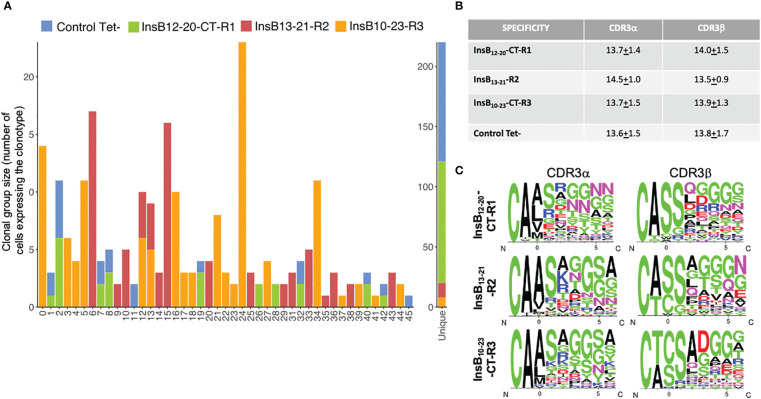
Clonotypic diversity of the tetramer+ vs tetramer- CD4+ T-cells arising in pMHCII-NP-treated mice. (A) Distribution of clonal sizes and TCR specificity. Data correspond to number of cells expressing each of the 45 different TCRαβ pairs that were found in more than one cell, or the ~300 that were found only once (labeled as “unique” in the plot). (B) Average length in amino acids (± SEM) of the CDR3α or CDR3β sequences of the TCRs expressed by the tetramer+ cells arising in response to treatment with the three different pMHCII-based nanomedicines. (C) Schematic representation of the percentage of prevalent amino acids at specific positions at the N terminus of CDR3 sequences (first 6 residues) for each pMHCII specificity normalized against the frequency of each residue at each position. Numbering of the CDR3 residues follows the nomenclature of Gioia et al., 2019 (12).

