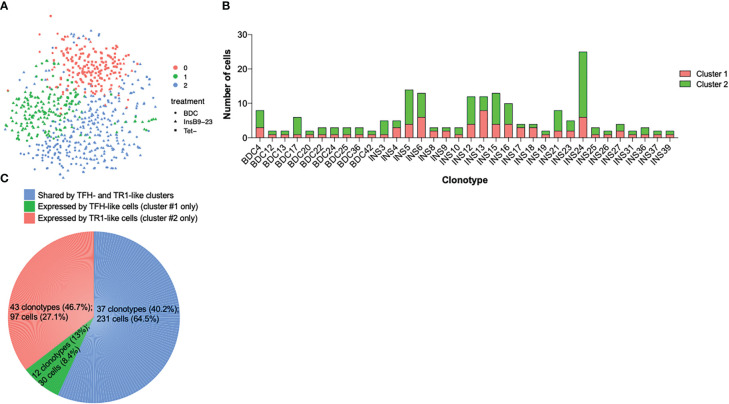
Figure 5.
Cluster distribution of repeated clonotypic TCRαβ pairs within tetramer+ cells of pMHCII-NP-treated mice. (A) Seurat clustering analysis of SMARTseq2-based scRNAseq data for sorted tetramer+ and tetramer– cells from NOD mice treated with BDC2.5mi/IAg7- or InsB9-23/IAg7-NPs (from n=5 and 15 mice, respectively). Most tetramer+ cells (63.6%) are found in cluster #2 (TR1-like). (B) Sub-cluster distribution of each of the repeated clonotypic TCRαβ pairs (found in more than one cell) for tetramer+ cells from NOD mice treated with BDC2.5mi/IAg7- or InsB9-23/IAg7-NPs. (C) Pie chart displaying the percentage of repeated clonotypes shared by clusters #1 and #2 or expressed only by clusters #1 or #2 among all clonotypes identified, as well as the number of cells expressing these clonotypes among all cells analyzed.

