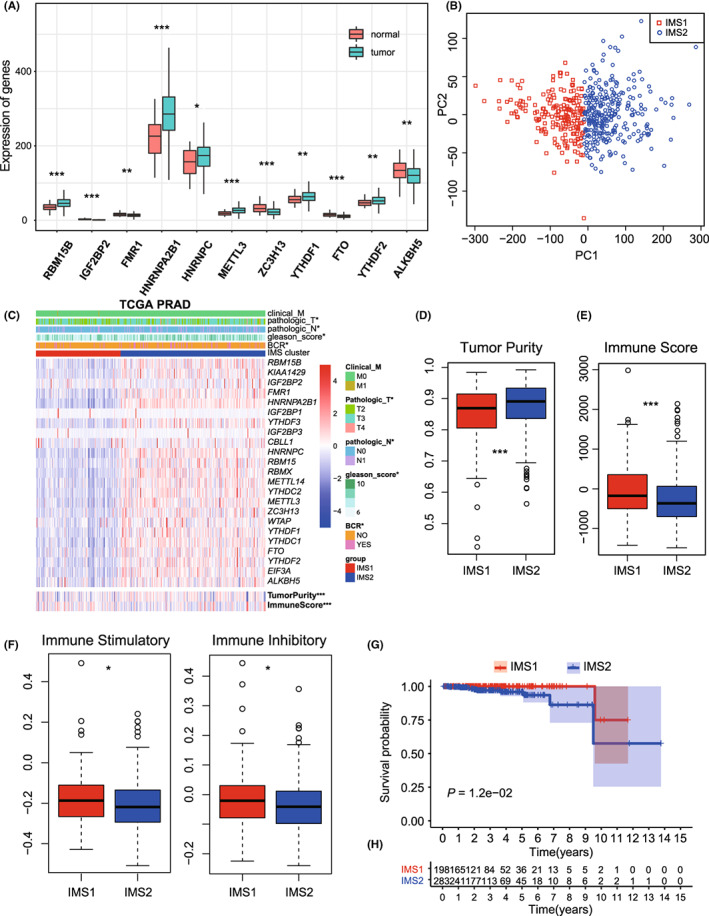
FIGURE 2.

DEMGs and cluster analysis. A, The bar plot of 11 DEMGs. B, Unsupervised clustering of PCa patients from TCGA PRAD dataset. C, The heatmap plot of differences in the clinical M stage, pathologic T stage, pathologic N stage, Gleason score, incidence of biochemical recurrence (BCR), tumor purity, and immune score between two clusters. D, E, Differences in the tumor purity and the immune score between two clusters. F, Differences in the state of tumor immune microenvironment, including stimulatory (left) and inhibitory (right) immune scores, between two clusters. G, Kaplan‐Meier plot of the comparison in the overall survival between two clusters. H, The number of patients in different clusters stratified by survival years. *p < 0.05; **p < 0.01; ***p < 0.001. DEMGs, differentially expressed m6A genes; PCa, prostate cancer; PRAD, prostate adenocarcinoma; TCGA, The Cancer Genome Atlas
