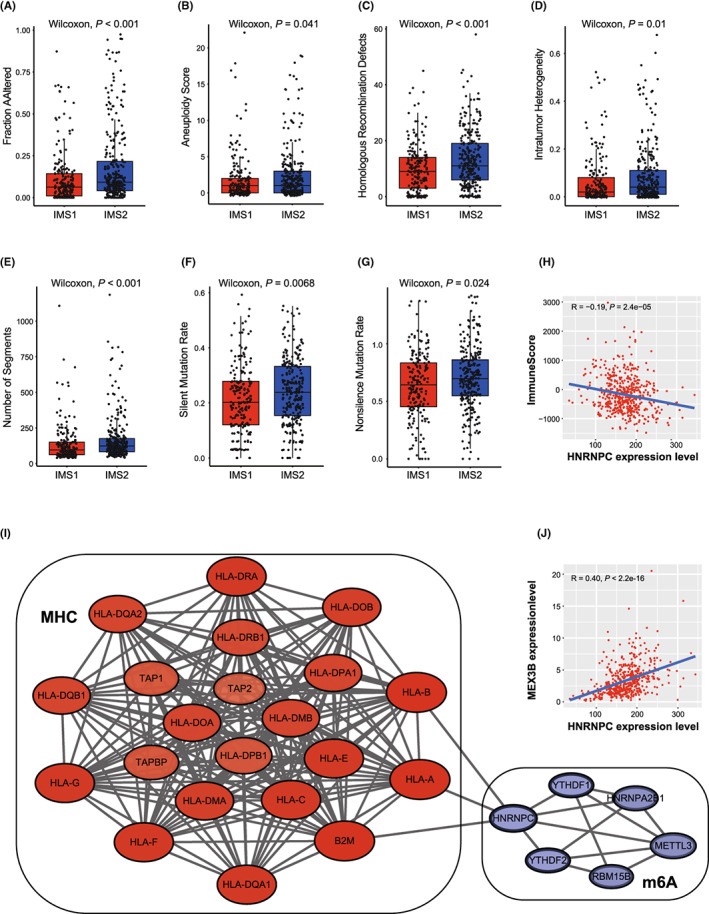
FIGURE 3.

Immune landscape of immune microenvironment subtype (IMS) clusters. A‐E, Measures of DNA damage, fraction altered, number of segments, aneuploidy score (AS), homologous recombination defects (HRD), intratumor heterogeneity (ITH), between clusters. F, G, silent and nonsilent mutation rate of IMS clusters. H, Correlation between the expression level of HNRNPC and immune score in TCGA database. I, Protein‐protein interaction (PPI) network of the interactions between immune‐related genes (IRGs) and major histocompatibility complex (MHC) module. J, Correlations of HNRNPC expression with MEX3B expression in TCGA database
