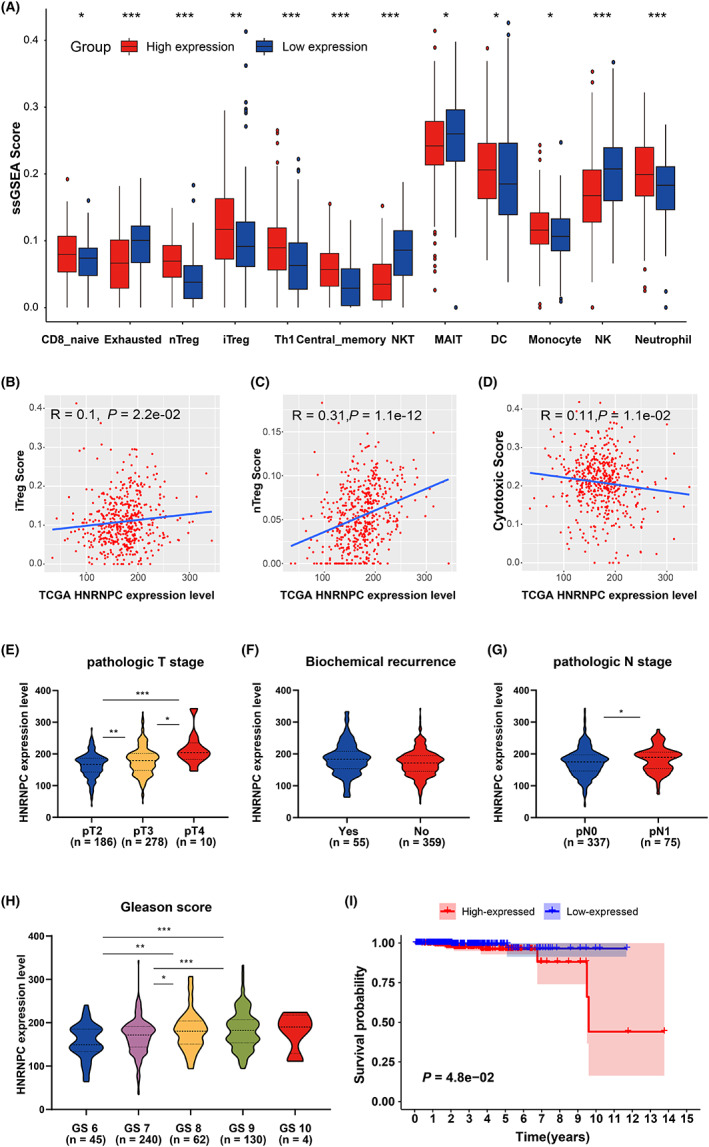
FIGURE 4.

Validation of the correlation between HNRNPC and immune microenvironment. A, Differences in the abundance of immune cells between the high‐expression group and low‐expression group (separated according to the median of HNRNPC expression level in GSE70768). *p < 0.05. B‐D, Correlations between HNRNPC expression and iTreg (B), nTreg (C), and cytotoxic T cells score (D). E‐H, Expression difference of HNRNPC between tumor patients with different pathologic T stages (E), biochemical recurrence condition (F), pathologic N stage (G), and Gleason score (H). I, Kaplan‐Meier plot of the comparison in the overall survival between HNRNPC high‐expression patients and low‐expression patients. TCGA, The Cancer Genome Atlas; PRAD, prostate adenocarcinoma
