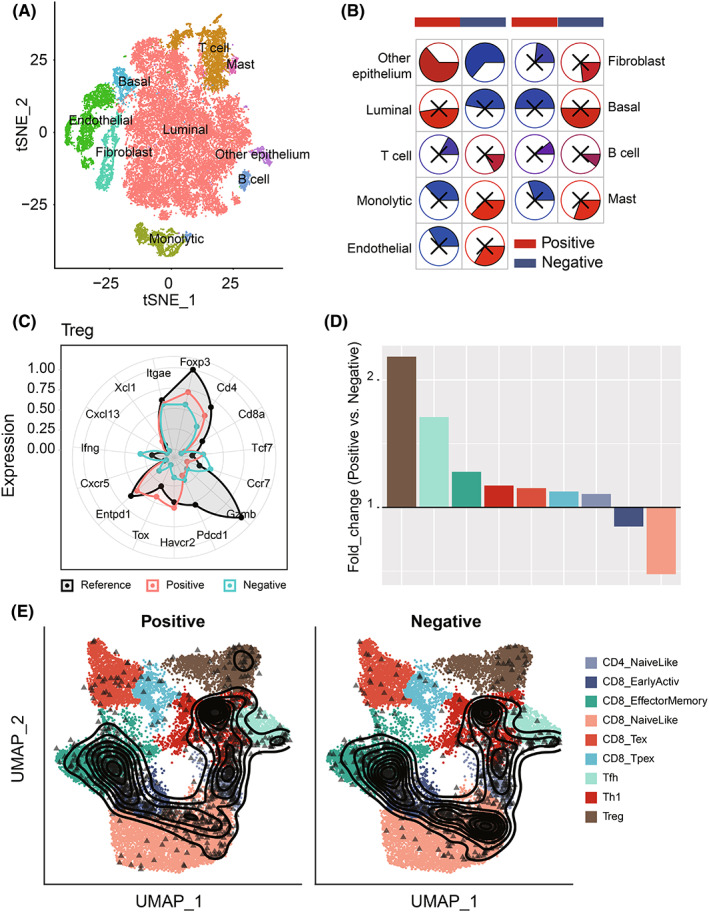
FIGURE 5.

Comparison of Treg proportion in HNRNPC‐positive cells and ‐negative cells on the single‐cell level. A, The tSNE clustering visualization of single‐cell RNA sequencing of prostate cancer. B, The tSNE plots of cells from patients with cells colored based on the cell types. C, Well‐known markers of eight cell types. D, The fold change of T cell subset composition of positive and negative cells. E, The tSNE plot of T cells colored by subtype and HNRNPC expression.
