
FIGURE 1.
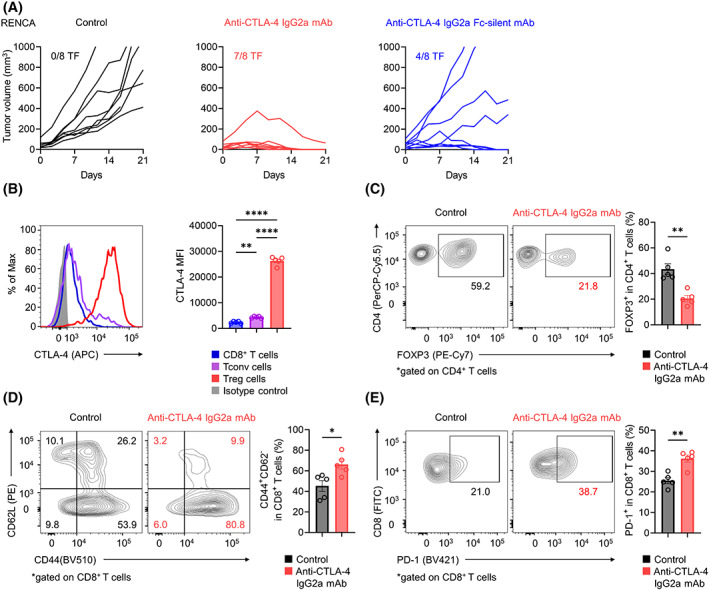
Anti‐CTLA‐4 mAb with ADCC activity and antitumor effects. (A) In vivo efficacy of various anti‐CTLA‐4 mAbs against RENCA tumors. BALB/c mice were injected subcutaneously with RENCA cells (2 × 10⁵). When the average tumor volume reached 50 mm3 (Day 0), various anti‐CTLA‐4 mAbs or control mAb was administered on Days 0, 3, and 6. Each tumor growth curve is shown according to the indicated groups. The number of tumor‐free (TF) mice per group is shown for each group. (B–E) CTLA‐4 expression, Treg cells, CD44+CD62L−CD8+ effector T cells, and PD‐1+CD8+ T cells in TILs. In vivo experiments were performed as described in (A). TILs were collected on Day 7 and subjected to flow cytometry. Representative flow cytometry staining (left) and summary data (right) of the mean fluorescence intensity (MFI) for CTLA‐4 in tumor‐infiltrating CD8+ T cells, Tconv cells, and Treg cells in the control group (B) and the frequencies of Treg cells (C), CD44+CD62L−CD8+ effector T cells (D), and PD‐1+CD8+ T cells (E) in TILs are shown. All in vivo experiments were performed in duplicate with similar results. One‐way ANOVA with the Bonferroni correction was used in (B). Unpaired t‐tests were used in (C–E). Bars, mean; error bars, SEM; *p < 0.05; **p < 0.01; ****p < 0.0001.