
FIGURE 4.
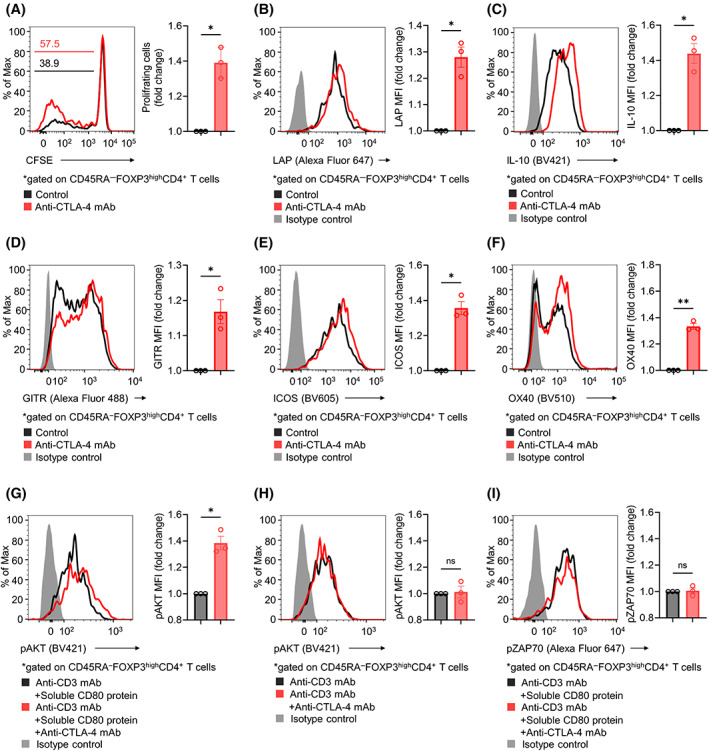
Influence of CTLA‐4 blockade on Treg cells in human PBMCs. (A) Proliferation of Treg cells in human PBMCs. CD4+CD25+ Treg cells were sorted from healthy donor PBMCs and subsequently labeled with CFSE. In total, 2 × 10⁵ CFSE‐labeled Treg cells were cultured in the presence of IL‐2, anti‐CD3 mAb, and soluble CD80 protein with or without anti‐CTLA‐4 mAb. Three days later, cell proliferation based on CFSE dilution was assessed by flow cytometry. The fold change in the frequency of proliferating Treg cells was calculated. Representative flow cytometry staining (left) and summary data (right) are shown. (B–F) Immunosuppressive cytokines and activation markers in Treg cells from human PBMCs. In vitro experiments were performed as described in (A). The cytokines and activation markers were analyzed with flow cytometry, and the fold change in mean fluorescence intensity (MFI) was calculated. Representative flow cytometry staining (left) and summary data (right) for LAP (B), IL‐10 (C), GITR (D), ICOS (E), and OX40 (F) are shown. (G–I) Phosphorylation of AKT and ZAP70 in Treg cells. Sorted Treg cells from healthy donor PBMCs were incubated with or without anti‐CTLA‐4 mAb in the presence of an anti‐CD3 mAb for 30 min on ice, followed by 30 min of incubation with or without soluble CD80 protein. T cells were then transferred to 37°C for stimulation for 30 min and subjected to flow cytometry, and the fold change in MFI was calculated. Representative flow cytometry staining (left) and summary data (right) for pAKT with (G) or without (H) soluble CD80 protein and of pZAP70 (I) are shown. Paired t‐tests were used. Bars, mean; error bars, SEM; ns, not significant; *p < 0.05; **p < 0.01.