
FIGURE 5.
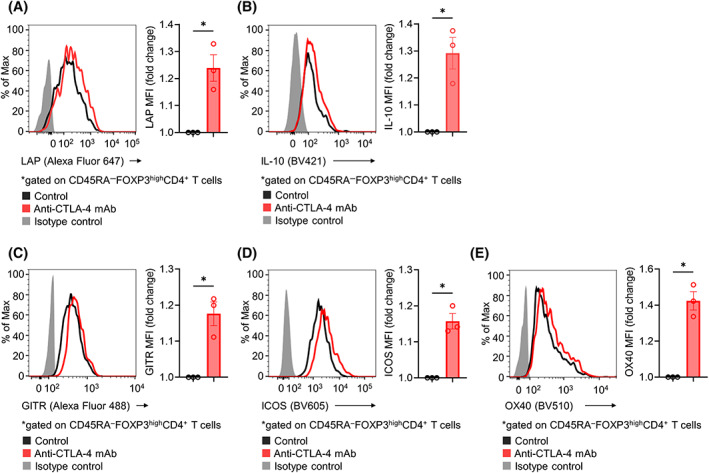
Influence of CTLA‐4 blockade on Treg cells in human RCC TILs. RCC tumors from three patients were minced to collect TILs. Sorted CD4+CD25+ Treg cells were cultured in the presence of IL‐2, anti‐CD3 mAb, and soluble CD80 protein with or without anti‐CTLA‐4 mAb for 24 h and were subsequently analyzed with flow cytometry. The fold change in mean fluorescence intensity (MFI) was calculated. Representative flow cytometry staining (left) and summary data (right) for LAP (A), IL‐10 (B), GITR (C), ICOS (D), and OX40 (E) are shown. Paired t‐tests were used. Bars, mean; error bars, SEM; ns, not significant; *p < 0.05.